Why Growth is Good, Even in Crisis


Last month we looked at the question of whether recent investment experiences have been able to support what is usually considered a reasonable estimate of portfolio withdrawal rates, a 4.5 per cent annual portfolio withdrawal, increasing with inflation. The exercise showed that a 4.5 per cent withdrawal rate was generally sustainable, provided the portfolio had exposure to growth assets (in the case of the model used, Australian and global shares) over both the last 15 and 25 years.
While completing the calculations for that article, the extent to which the last 15 years of investment returns had been challenging became apparent. The combination of the Global Financial Crisis, COVID-19 downturn and historically low interest rates created (and continues to create) a range of challenges for investors. As much as most of us would happily swap these challenges for more sedate times, they provide an interesting timeframe in which to test investment strategies.
The focus of this article is investors in the accumulation phase of their investment lifecycle, particularly looking at the impact on portfolio performance of decisions around asset allocation during this 15-year period.
It shows, in short, that a mid-30s superannuation investor would end up with a higher superannuation balance the greater the exposure to growth assets that they had.
Setting up the Model of Investment Returns
We consider the superannuation balance of someone who started with $100,000 as their account balance (perhaps someone in their mid-30s) and has annual contributions (after superannuation contributions tax) of $10,000 per year. We consider the 15-year period of investment returns from 2007 to 2021 inclusive.
The initial portfolio considered has an allocation of 70 per cent growth assets (50 per cent of the portfolio Australian shares and 20 per cent unhedged global shares) with the remaining 30 per cent of the portfolio invested in cash. Returns are after fees (0.5 per cent of the portfolio balance) and tax at the superannuation rate, with the return from franking credits included. For each asset class it is assumed that the return is the average asset class return each year, the index return.
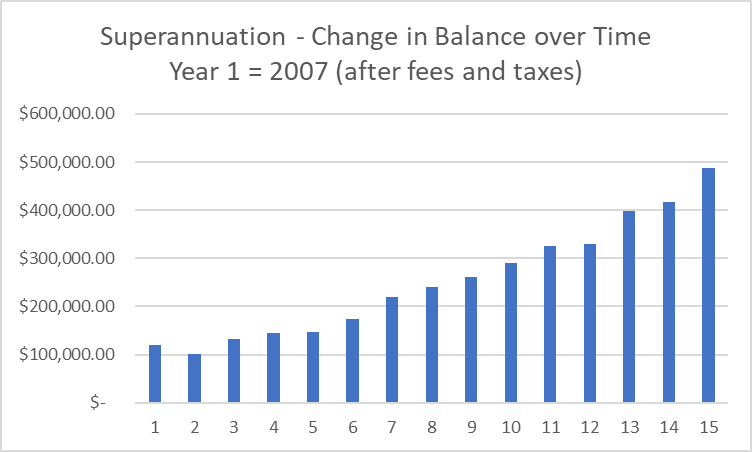
A portfolio with a 70 per cent growth asset allocation is a reasonably standard offering in the pre-mixed portfolios available to investors. The results from a 70 per cent growth asset allocation portfolio suggest that despite being behind after the first two years of the portfolio, the ending balance of $487,000 is a reasonably attractive result over the 15-year period. If we subtract the starting portfolio value of $100,000, and the $10,000 per year in contributions, we can see that the portfolio has increased in value by $237,000 through investment earnings.
The following table represents the experience of the investor in the 70 per cent growth portfolio, compared with the experience if the investor only had 30 per cent growth assets or 0 per cent growth assets. The ending portfolio balance is split into two components – the amount contributed to the portfolio (initial $100,000 plus $10,000 per year for 15 years, $250,000 in total for each portfolio), and the investment earnings, the value of the ending portfolio less the $250,000 contributed.
15-Year Superannuation Returns – Various Asset Allocations
|
|
70 per cent growth |
30 per cent growth |
0 per cent growth |
|
Ending Portfolio Value |
$487,000 |
$393,000 |
$318,000 |
|
Investment Earnings over 15 Years |
$237,000 |
$143,000 |
$68,000 |
|
Starting Balance plus Contributions |
$250,000 |
$250,000 |
$250,000 |
It’s clear that over a 15-year period where investment returns have been challenging, investors have been rewarded for having a higher exposure to growth assets. If we want to emphasise the impact of investment returns, we could say that the investment earnings from holding 70 per cent growth assets in a portfolio are more than three times the investment earnings from having a portfolio with no growth assets.
The 100% Experiment
Given the results from 0 per cent, 30 per cent and 70 per cent growth assets portfolios, it is interesting to consider what the results might be for a 100 per cent growth portfolio. Assuming a 70 per cent exposure to Australian shares and 30 per cent exposure to global shares, the calculations for the portfolio show an ending portfolio balance of $578,000. This is $91,000 more than the ending balance of the 70 per cent growth portfolio.
This result continues the trend that even over a 15-year period of relatively poor investment returns (2007 to 2021) a superannuation investor is increasingly rewarded for exposure to growth assets.
Discussing the Results
It is worth acknowledging that while the market returns over this period were below the long-run returns experienced by investors in the Australian markets (for example, over this period Australian shares had an average annual return of 8.16 per cent per annum), there is potential for periods where returns might be even less favourable. It should not be assumed that this models a ‘worse case’ scenario.
It is also reasonable to reflect on the adequacy of the returns experience by the investor over this period of time, using a naïve ‘buy and hold’ strategy. If we assume that they were about 35 in 2007, with $100,000 in their superannuation account, by the end of the experiment being 50 with $487,000 (70 per cent growth portfolio) or $578,000 (100 per cent growth portfolio) seems to be an acceptable outcome. Trying to make market timing decisions, and changing superannuation asset allocations, runs the risk of eroding these outcomes.
For younger investors, choosing a ‘balanced’ portfolio (perhaps similar to the 70 per cent growth portfolio) is a common option. However, an investor with a very long investment timeframe (a 35-year-old might still be using their superannuation portfolio in 60 years’ time), there remains the argument that they are likely to benefit from a higher growth portfolio, provided they have the capacity to cope with the increased volatility of the portfolio.
The 100 per cent growth portfolio modelled in this scenario is a good example of volatility: after two years of $10,000 of contributions, the original $100,000 invested and two years of investments returns, the value of the portfolio was $87,000. Many people would have given up at this stage and missed out on future returns.
Conclusion
The years 2007 to 2021 inclusive have provided an interesting 15 years of investment data on the back of the Global Financial Crisis, COVID-19 downturn and historically low interest rates. For those accumulating wealth, exposure to growth assets over this period still provided rewards for investors, right through to a 100 per cent growth portfolio.
The specific scenario modelled, a superannuation investor starting around the mid-30s, saw a higher ending superannuation balance (after fees and taxes) the greater the exposure to growth assets that they had.
This article originally appeared in the Eureka Report - To find out more about how an Eureke Report membership can help you click here


Frequently Asked Questions about this Article…
Growth is important for investors even during a crisis because it can lead to higher investment returns over time. Despite challenging periods like the Global Financial Crisis and COVID-19 downturn, portfolios with higher exposure to growth assets have shown better performance.
Asset allocation significantly impacts portfolio performance. The article shows that a portfolio with a higher percentage of growth assets, such as Australian and global shares, tends to have better returns compared to portfolios with lower growth asset exposure.
A 70% growth asset portfolio, with 50% in Australian shares and 20% in global shares, ended with a balance of $487,000 over 15 years. This was achieved despite initial setbacks, demonstrating the long-term benefits of growth asset exposure.
A 100% growth asset portfolio, with 70% in Australian shares and 30% in global shares, resulted in an ending balance of $578,000. This highlights the potential rewards of full growth asset exposure, even in challenging market conditions.
Yes, a 4.5% withdrawal rate is generally sustainable if the portfolio includes growth assets. The article suggests that exposure to growth assets can support this withdrawal rate over long periods, even during challenging market conditions.
Younger investors should consider a balanced portfolio with significant growth asset exposure. Given their long investment horizon, they can benefit from the higher returns associated with growth assets, provided they can handle the associated volatility.
The period from 2007 to 2021 was marked by challenges like the Global Financial Crisis and COVID-19 downturn. Despite these, portfolios with higher growth asset exposure still provided substantial rewards, emphasizing the importance of maintaining growth assets in investment strategies.
Frequently changing asset allocations can erode potential investment outcomes. The article suggests that sticking to a growth-focused strategy, rather than attempting market timing, can lead to better long-term results.


