US shares looking peaky


Summary: Bulls argue that the share rally that started in 2009 is a new secular bull market, buoyed by technological breakthroughs. Bears say the US stock market is overvalued, and on fundamentals it does look overstretched. |
Key take-out: The bears might be right, but until stock markets breach their long-term price trends I shall stay in shares via ETFs. |
Key beneficiaries: General investors. Category: Shares. |
America accounts for over half the value of global stock markets. That's why if a crash happened on Wall Street it would quickly reverberate around the world. So it's timely to refocus on the US after dwelling on Greece and China recently.
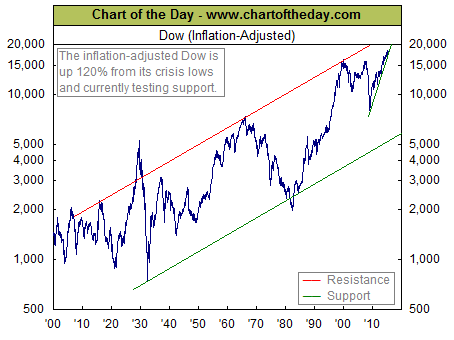
The following chart illustrates the inflation-adjusted US Dow Jones share index since 1900. At present – note that the market is closer to its long-term red resistance trend line than its long-term green support trend line.
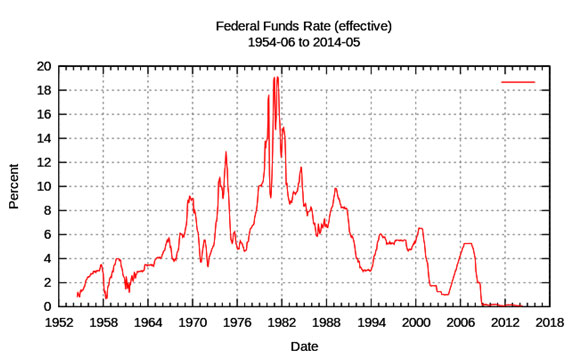
The big question hanging over the US share market is: When will the Federal Reserve jack up interest rates and will this trigger a stock market crash?
The bulls say any rate rises will be small and gradual and that the slower growth outlook for America and the world (the “new normal” referred to by the IMF, World Bank and OECD) means that the Federal Funds Rate (which underpins all US cash rates) even when “normalised” will stay below its historic average of around 5 per cent.
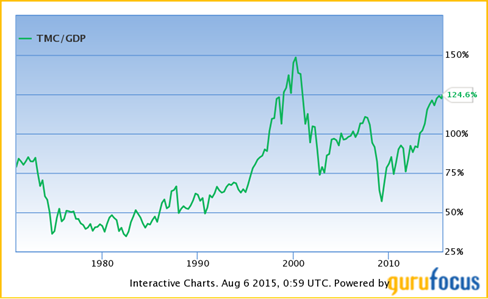
The bulls also contend we have embarked on a new industrial revolution made possible by the internet, bio-technology and robotics. These technological breakthroughs will lift both demand and production to new heights and confirm that the share rally that started in March 2009 is a new secular bull market that could last as long as the previous one between 1982 and 2000. See chart below.
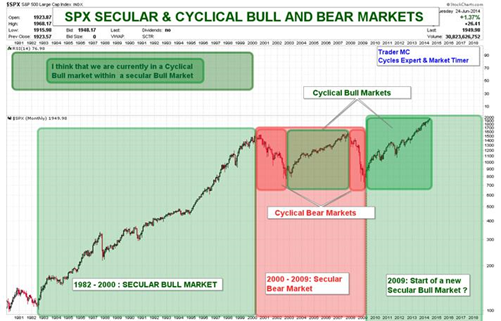
Source: Tradermc.com
The bears say the American stock market is overvalued and so the Federal Reserve's first move to raise interest rates in nine years coming on top of its decision last October to cease quantitative easing (i.e. money printing to buy bonds) will be the starting gun for a stampede out of bonds, property and shares. This they say will bring on a crash like 2008.
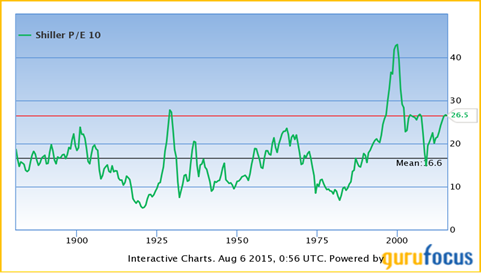
On fundamentals, America's share market looks overstretched by historic standards. Here is Nobel laureate Professor Robert Shiller's price/earnings valuation index of the US share market for the past 135 years. It's now not as high as it was in 2000 (just before the dot.com crash), but it matches the level it reached in 2007 (just before the banking bust).
Another gauge of whether the American share market is overpriced is its total value (capitalisation) expressed as a percentage of the economy's annual GDP. As can be seen in the chart below its current level sits between what it reached in 2000 and 2007.
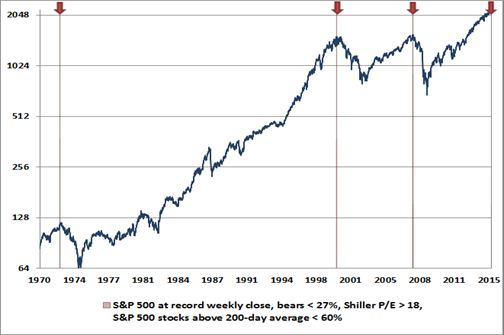
Respected US stock market analyst, Dr John Hussman, founder and CEO of Hussman Funds, says that the bell has already rung for a market top and a crash is imminent. Hussman has found that each market top in the last 50 years (other than 1987) was marked by the following four indicators; the first three being signs of irrational investor exuberance and the last being evidence of faltering market momentum:
- The Shiller Price/Earnings ratio (S&P 500 divided by 10 year average of inflation-adjusted earnings) is greater than 18;
- The S&P 500 reached a record weekly closing high within the prior eight weeks;
- Fewer than 27 per cent of financial advisors have a bearish market outlook according to the Investors Intelligence survey; and
- Fewer than 60 per cent of S&P 500 stocks were above their respective 200-day moving averages.
Here is his chart of how these indicators called US stock market tops in 1972, 2000, 2007 and now in 2015.
Hussman obviously believes he has uncovered what no one else has – a way to predict crashes just before they happen. Here's his dire warning from his July 27 weekly market commentary:
“…this is no time to be on autopilot. Look at the data, and you'll realize that our present concerns are not hyperbole or exaggeration. We simply have not observed the market conditions we observe today except in a handful of instances in market history, and they have typically ended quite badly.
“In my view, this is one of the most important moments in a generation to examine all of your risk exposures, the extent to which you believe historical evidence is informative, your tolerance for loss, your comfort or discomfort with missing out on potential rallies even in a wickedly overvalued market, and your true investment horizon…. review all of your risk exposures here.”
A sceptic might argue that filtering stock market data to spot four common traits prior to each previous crash that coincide with current conditions does not prove the market will topple this time because each crash has a unique feature that Hussman ignores.
For instance the 2000 crash was preceded by an internet speculative bubble and the 2008 crash by a financial system meltdown. At present there is no obvious trigger for a bust other than an elevated market valuation. Also America's economy is strengthening, not slipping into recession. We shall soon know whether Hussman's warning is prescient or false.
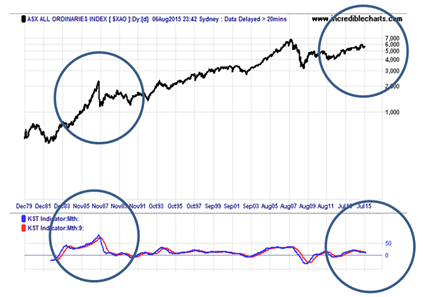
Also Hussman's concern that a coming crash could be sharp and swift is possible though unlikely. Before the last major flash crash in October 1987 the monthly KST indicator (a good measure of market exuberance) was much higher than it is now. The next chart shows the All Ords index on a log scale to make a valid comparison between both periods. The big flash crashes of 1987 and 1929 were preceded by heightened KSTs.
John S. Tobey, a leading contributor to Forbes magazine, remains fully invested in US stocks because he believes the recent sideways drift of the stock index is simply the market taking a rest before its next take-off.
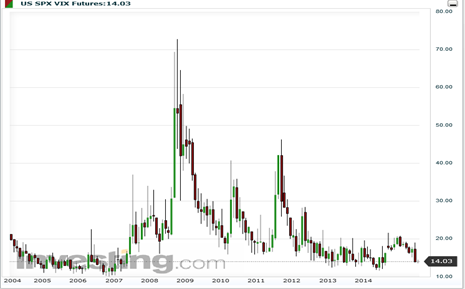
Tobey points to the VIX or fear index, a measure of the market's volatility, which has fallen to 14 which is very low. Previous crashes did not happen before the VIX rose above 20. The recent Greek debt drama and Chinese stock crash saw the VIX briefly reach 18, but then fall back again because neither of these countries matters much to the US economy.
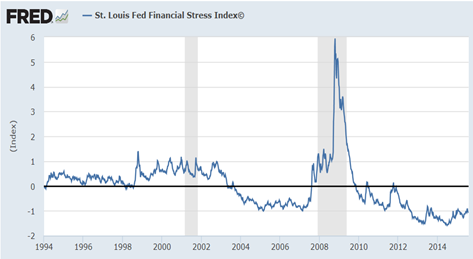
Also the Fred Financial Stress Index (which measures the uncertainty within the US financial sector) remains low compared with the levels that preceded the crashes of 2000 and 2008.
PIMCO's newly appointed global economic adviser Joachim Fels says the world economy is characterised by three “gluts”: money, savings and oil. In his view:
"While the global savings glut is likely the main secular force behind the global environment of low growth, low inflation and low interest rates, both the oil and the money glut should help lift demand growth, inflation and thus interest rates from their current depressed levels over the cyclical horizon."
Fels also believes the central banks of China and other commodity-producing countries will follow those of Europe and Japan in easing monetary policy, thereby offsetting any tightening by the Federal Reserve.
Jonathan Golub, Managing Director for RBC Capital Markets and one of Wall Street's most prolific market strategists, argues the “new normal” of low growth, low interest and low inflation is bullish for stocks.
So who should you believe and what should you do? As always my advice is don't trust market forecasters, but instead use a trend-following or momentum strategy to gauge what is actually happening and then stay on the right side of the market.
Put simply, the trend is our friend until it bends. The trend's momentum is a measure of its conviction. Together these indicators signal when it's best to be in shares (through listed equity funds) and when it's safest to be in cash. See Riding out a rough patch (July 15) for an explanation of how to use trend and momentum analysis to sidestep share market crashes.
Bears like Hussman might be right, but until the Australian and global stock markets breach their long-term price trends and exhibit negative momentum I shall stay in shares via ETFs.
Percy Allan is a director of MarketTiming.com.au. For a free three week trial of its newsletter and trend-trading strategies for listed ETF funds, see www.markettiming.com.au.


