The housing rally to have, when you're not having a rally
In October last year, when the first signs that Australian nominal house prices were rising again after falling since June 2010, I argued that this was going to be a “suckers’ rally” (Riding the great debt elevator, October 8, 2012).
I stuck with that call (Where to for house prices in 2013? December 17, 2012) even when the data appeared to be showing a revival in my key indicator, the “Mortgage Accelerator” (Don't look for high-rise house prices, February 11), largely because I couldn’t see mortgage acceleration being maintained when mortgage debt was still within cooee of its historic high.
But last week’s ABS House Price Index was surprising even to a bona fide housing bear like myself: nominal house prices rose a whole 0.1 per cent over the March quarter. In inflation-adjusted terms, it appears that the recent house price rise ran out of steam in January, and resulted in prices being a whole 1.8 per cent higher, in real terms, than at the nadir in September. They are now just 1.6 per cent higher.
Table 1: House Prices and Consumer Prices
Nominal House Price | CPI | Real House Prices | ||||
Date | Index | Change Qr | Index | Change Qr | Change | Index |
2010.5 | 149.8 | 16 | 95.8 | 0.63 | 15.37 | 100 |
2010.75 | 148.1 | 9.9 | 96.5 | 0.731 | 9.169 | 98.148 |
2011 | 148.8 | 4.6 | 96.9 | 0.415 | 4.185 | 98.205 |
2011.25 | 147.3 | 0.1 | 98.3 | 1.445 | -1.345 | 95.83 |
2011.5 | 145.8 | -2.7 | 99.2 | 0.916 | -3.616 | 93.994 |
2011.75 | 143.1 | -3.4 | 99.8 | 0.605 | -4.005 | 91.699 |
2012 | 142.3 | -4.4 | 99.8 | 0 | -4.4 | 91.186 |
2012.25 | 142.3 | -3.4 | 99.9 | 0.1 | -3.5 | 91.095 |
2012.5 | 143.2 | -1.8 | 100.4 | 0.501 | -2.301 | 91.214 |
2012.75 | 142.9 | -0.1 | 101.8 | 1.394 | -1.494 | 89.771 |
2013 | 145.8 | 2.5 | 102 | 0.196 | 2.304 | 91.414 |
2013.25 | 146 | 2.6 | 102.4 | 0.392 | 2.208 | 91.181 |
Some boom. That’s not even a Suckers’ Rally – it’s a Claytons Suckers’ Rally (for non-Australian readers, a ‘Claytons’ is ‘the drink you have when you’re not having a drink’).
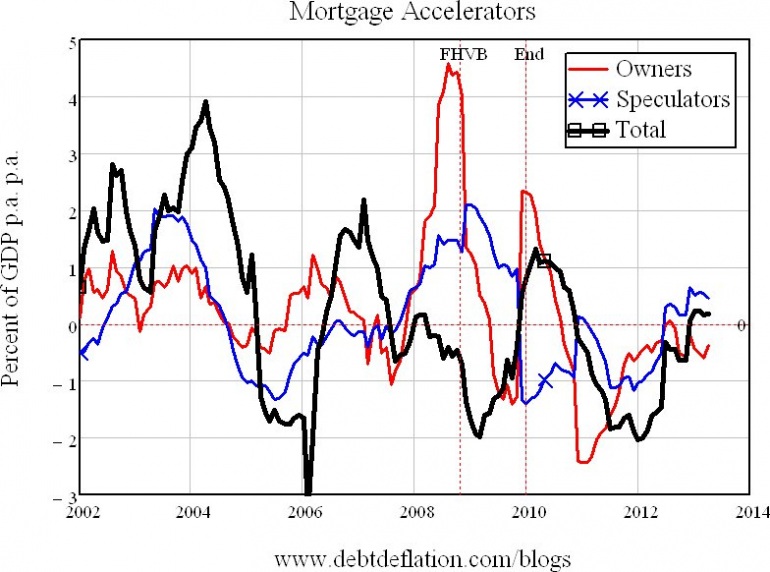
My mortgage accelerator indicator gave an inkling that this could happen, since it peaked out at a mere 0.23 per cent of GDP in January (versus 5 times that during the First Home Vendors Boost), and then fell to below 0.2 per cent.
Figure 1: House Price Change and Mortgage Debt Acceleration
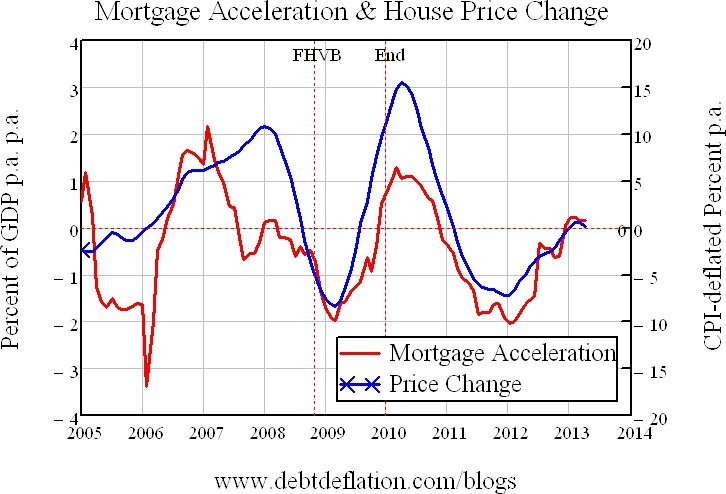
But since there are many cooks at work in baking the Australian house price cake – from meddling federal and state governments and allegedly rigid councils on the government side, to unregulated and unmonitored overseas buyers in a wide-open domestic real estate market on the private side – I didn’t want to stick my neck out and say that the price rise was over now, since any of those factors could have outweighed mortgage debt acceleration.
I still think this mini-rally could revive a bit (and the most recent figures may well be revised upwards, as the previous quarter’s were with more data), but it is clearly on the edge of deflating after a truly anaemic rise.
This data hasn’t yet dented the enthusiasm of the bulls – my fellow Spectator Stephen Kouloulas stuck with his call for a 8-12 per cent rise in nominal house prices over 2013, and Stephen Nicholas (and interviewees) in The Sydney Morning Herald managed to wax lyrical about how last Tuesday’s Reserve Bank interest rate cut would “generate house price growth“, without once mentioning the flat ABS figures that came out the same day (Agents welcome surprise rate cut, SMH May 7, 2013).
Figure 2: The Kouk's affirmation of his call for an 8-12 per cent rise in Australian house prices in 2013

Nor did their mention of “flying” clearance rates of 78.1 per cent in Sydney last week note that this is more terrain-hugging than high-flying, since the volume of sales is now 27 per cent lower than during the FHVB-inspired boom in 2009, and 40 per cent below the peak level of sales back in 2003 (see figure 3).
Figure 3: A Booming market?
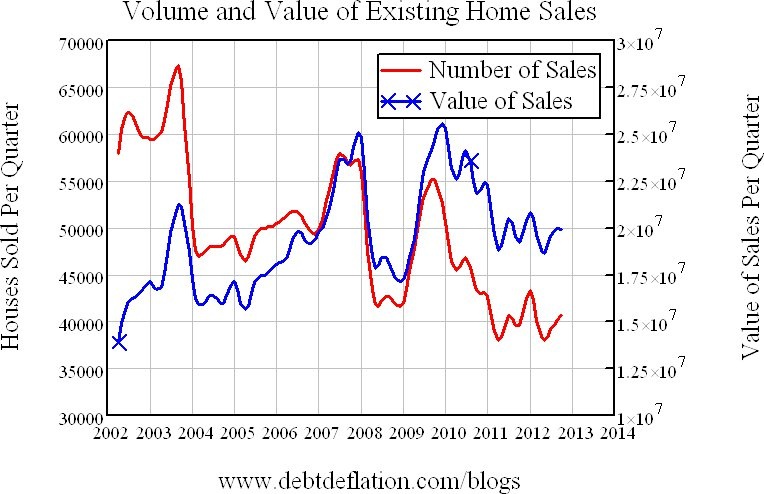
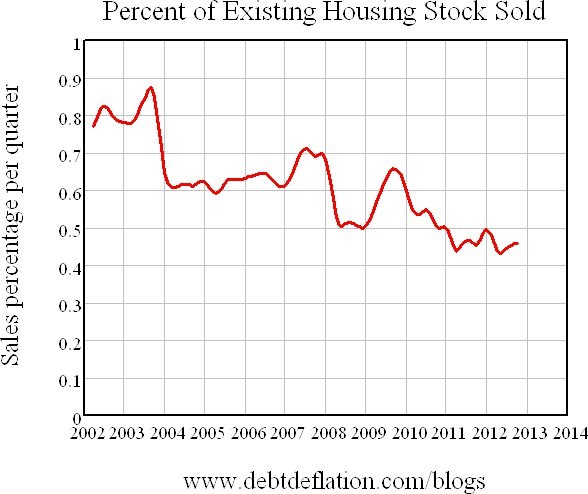
Since the housing stock has grown over time, the current “booming market” involves almost the lowest level of sales volume compared to housing stock since the ABS began collecting the data in 2002 (see figure 4). This is almost certainly a factor in why the current rise petered out so quickly – and why any house future price revival is likely to be short-lived: any apparent revival in prices is likely to bring out an increased supply from would-be vendors awaiting such a price rise. Since the volume of sales is so depressed compared to the boom times of 2002-2008, any temporary revival in prices can easily be snuffed out by an increase in sellers.
Figure 4: Housing sales as percentage of housing stock
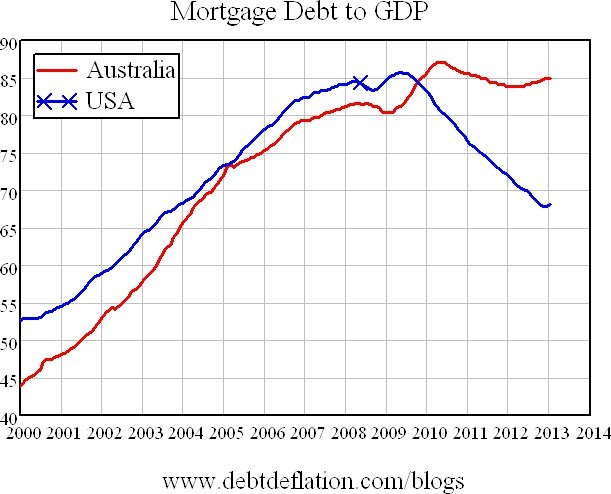
With the supply of existing houses for sale so flexible, the only salve for the market could emanate from equally flexible demand. That’s somewhat the case in the US now, since mortgage debt has dropped so much there – and since with lower prices, rental yields are now attractive to genuine investors (i.e., people who plan to profit from being landlords rather than making a tax-deducting loss as in Australia).
In part, this reflects the pain the US has already been through with substantial deleveraging and even larger price falls. Australia avoided this pain, with the First Home Vendors Boost pushing prices up at the same time as floating mortgage rates reduced the cost of carrying mortgages. But the downside of ‘no pain’ is ‘no gain’: whereas the global financial crisis led to actual falls in mortgage debt (and all other categories of private debt) in the US, all it did in Australia was slow down its rate of growth to slightly lower than that of nominal GDP. Consequently mortgage debt is now little different to what it was at the house price peak in June 2010 – and therefore the room for it to rise is also limited.
Figure 5: The US delevered, Australia did not
Of course further interest rate cuts might well entice more people into mortage debt – and as Peter Martin pointed out, just because the Reserve Bank’s cash rate is the lowest it has been since Elvis was in the Army (as opposed to in the House), that doesn’t mean that mortgage rates are as low as they can go. They are still above the lows they set during the GFC, and another three cuts in the cash rate would be needed to take them below that level (How low will the RBA go? SMH, May 8).
Figure 6: Mortgage rates still high after all these cuts
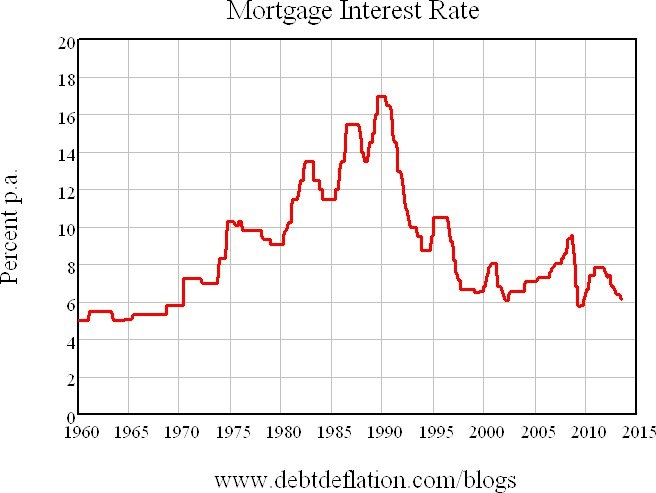
So we may well see mortgage rates that low, or even lower. But while mortgage debt remains as high as it is, we will never see mortgage servicing costing as little as it did before the most recent Australian house price bubble began in 1997 – let alone as low as it was in the 1970s – even if the Reserve Bank dropped the cash rate to zero, and mortgage rates fell to just 3 per cent.
Figure 7: Mortgage interest payments as a percentage of GDP
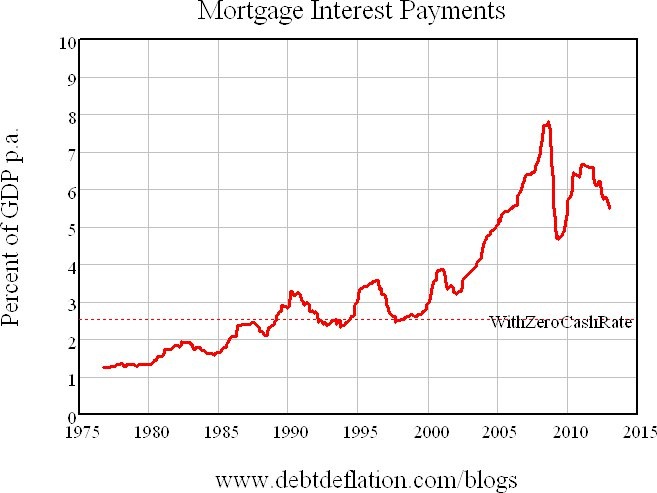
That isn’t factoring in the repayment of mortgages either. Before the price boom, this wasn’t a major issue: mortgage debt was relatively small compared to GDP, and a large variation in how long people took to repay loans had a minor effect on debt servicing costs as a percentage of total income. During the price boom, this wasn’t a major issue: you could struggle with repayments for a while and then repay by selling your property into the rising market seven years after you bought it. But after the boom, repaying mortgages as fast as Australians have done in the past will be prohibitively expensive. Mortgage durations are therefore likely to blow out, which will make the thought of taking out mortgage debt that much less attractive.
Figure 8: Mortgage payments given different repayment periods
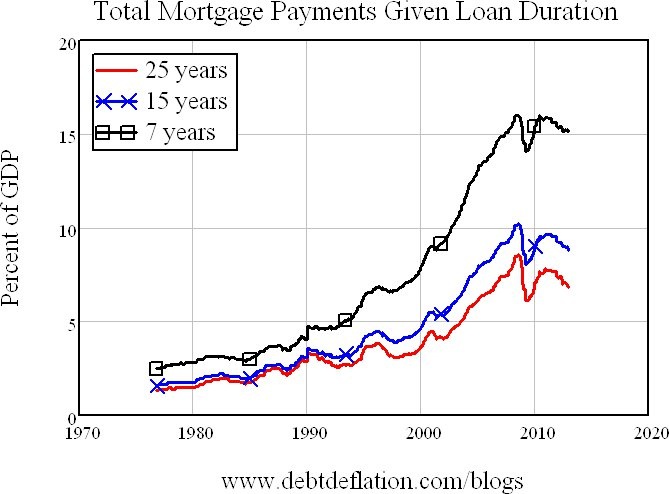
So demand is anything but flexible up, and the trend to falling mortgage debt growth rates is likely to continue.
Figure 9: New mortgages per annum
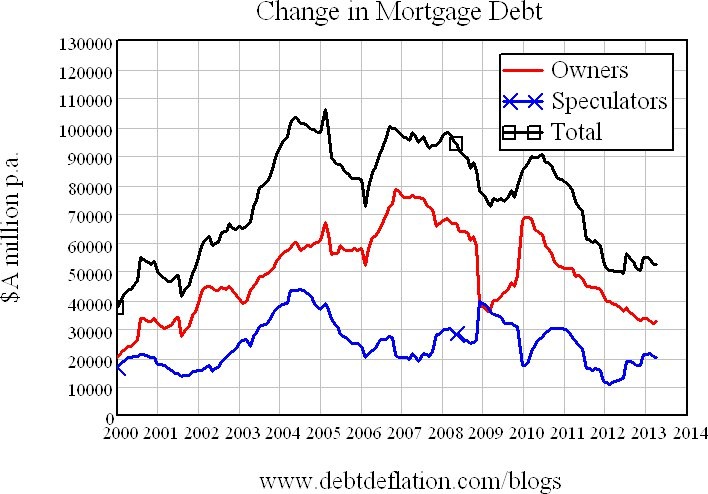
With that trend, any period of accelerating debt – and therefore rising prices – is likely to be short-lived, as appears to be the case in this Claytons Suckers’ Rally.
Figure 10: Australian Mortgage accelerators
