Reading the Bitcoin Runes


Since the all-time-high of $A84,000 in mid-April, Bitcoin’s price has taken a roller-coaster ride down to $40,000 in mid-July, back to around $77,000 as of writing.
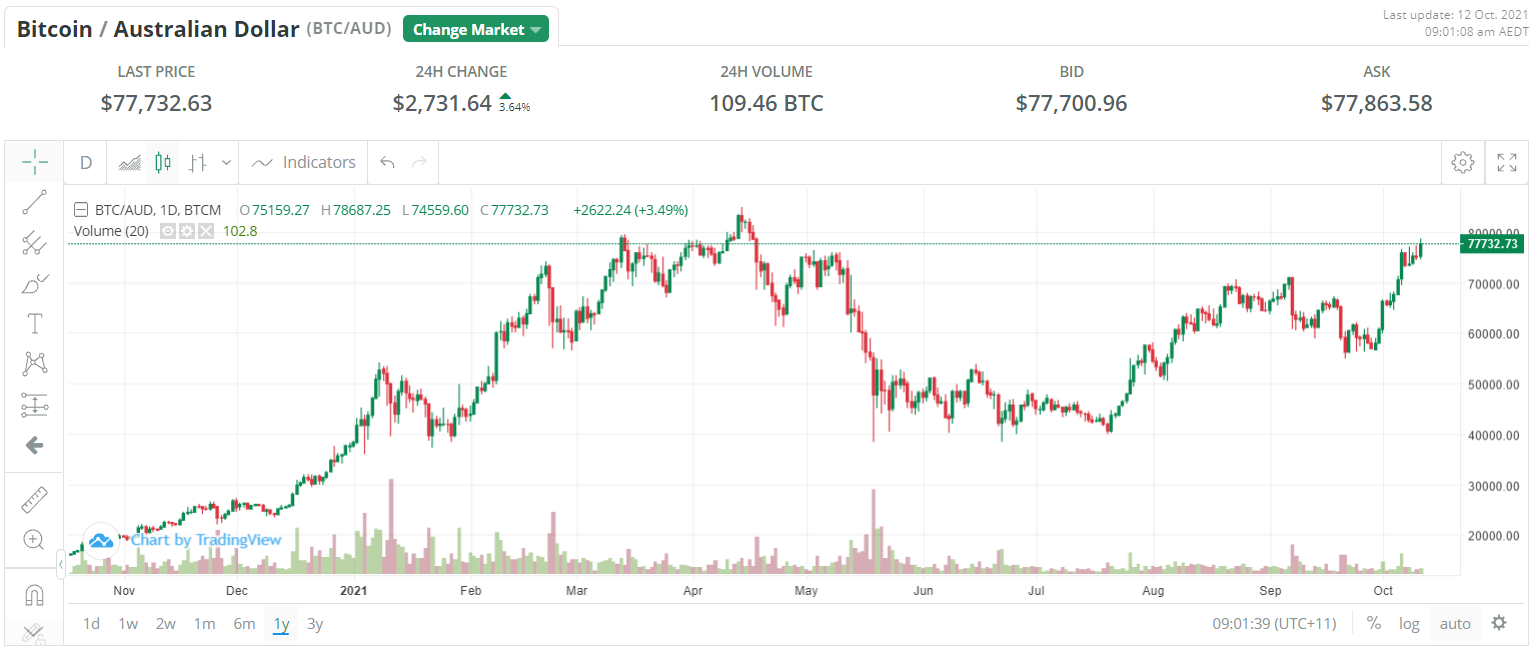
Source: https://www.btcmarkets.net/
Of course, Bitcoin traders and investors are used to this kind of price action as the all-time chart demonstrates:
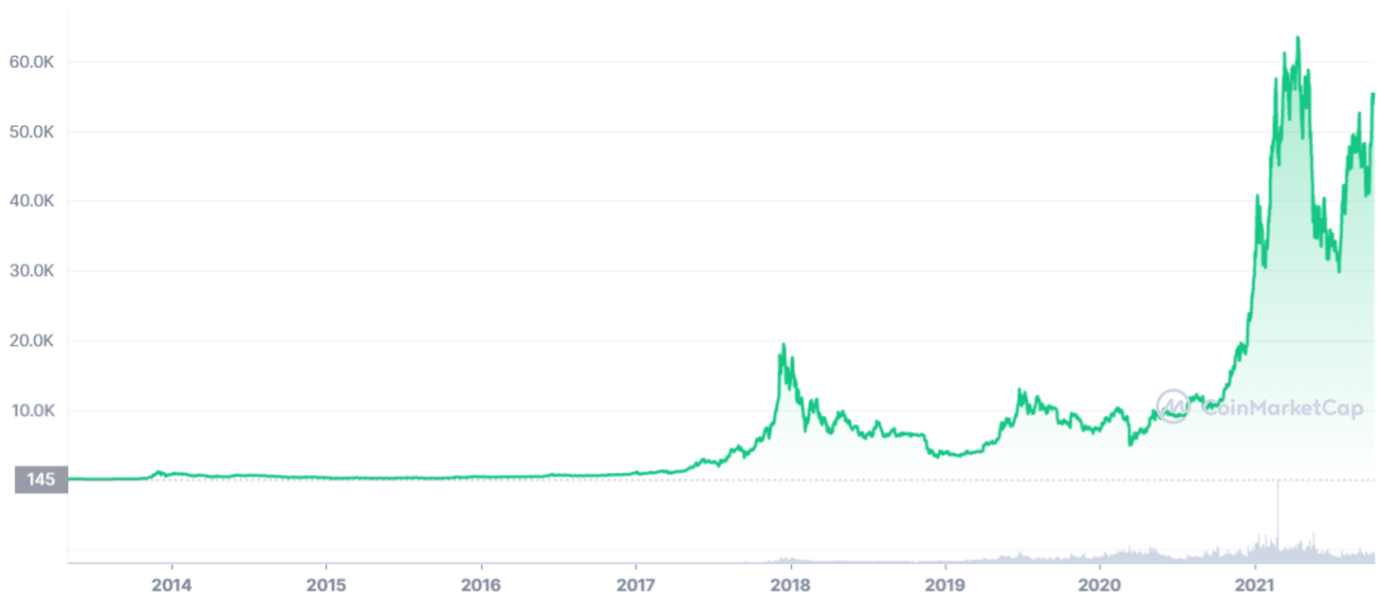
Source: https://coinmarketcap.com/currencies/bitcoin/
But the historical price action becomes more interesting and actionable when both price and time is converted to a log scale:
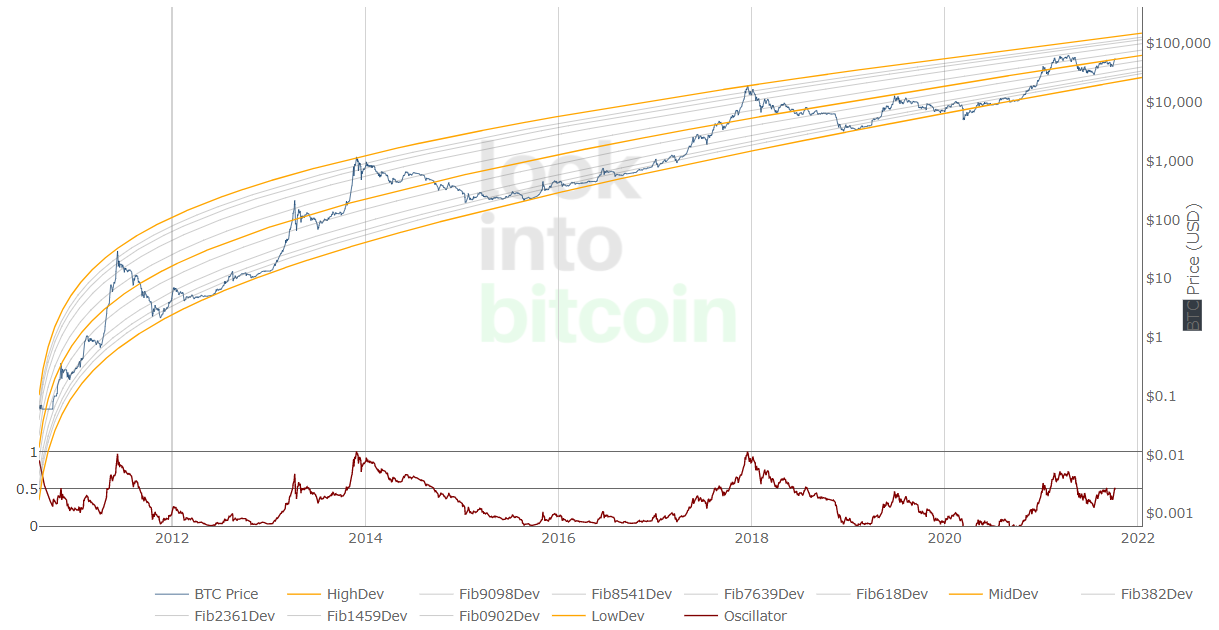
Source: https://www.lookintobitcoin.com/charts/bitcoin-logarithmic-growth-curve/
This chart shows Bitcoin’s price moving within a well-defined price channel, through bull and bear market cycles, and corresponding high (resistance) and low (support) points along the journey which shows a clear cyclic pattern.
This pattern correlates well with Bitcoin’s “halvening” cycle in which the block reward for mining bitcoin transactions is cut in half every four years or so. The previous “halvenings” occurred in November 2012, July 2016, and May 2020, and the price increased into and out of each prior halvening.
The bull ran for some 370 days in 2012 and over 570 in 2016. If future price action follows a similar pattern to its historical behaviour, then Bitcoin has quite some way to go before reaching a peak in this current cycle (from the COVID-19 triggered liquidity crisis of March 2020). The log chart suggests it could rise north of $200,000 as soon as January or February 2022 if it follows its historical journey along the channel!
Of course, past performance is no guarantee of future performance, and certainly can’t predict “black swan” events. So smart investors should also consider fundamental factors such as the macro environment and “on-chain” data to supplement the price action.
Macro Drivers
Low interest rates and significant fiat debasement through quantitative easing are strong macro tailwinds for Bitcoin, as is growing clarity around the regulatory landscape.
US Federal Reserve Chairman Jerome Powell recently said he does “not intend to ban cryptocurrencies” when asked by the House Financial Services Committee.
Earlier this year Gary Gensler, head of the US Securities and Exchange Commission suggested that Bitcoin was not a security (which is regulated), but rather a utility token (which isn’t). He also said: “I think the transformation we're living through right now could be every bit as big as the internet in the 1990s".
A further boost comes from Bank of America’s Global Research team which published a Digital Asset Primer report covering the digital asset and crypto space. The report said that:
- “we are only in the first innings of a major change in applications across most industries that will take place over the next 30 years”;
- “It’s difficult to overstate how transformative blockchain technology, digital assets and the thousands of decentralized apps that have yet to be created could potentially be”; and
- “for us, digital assets are not about payments per se. They’re about a new computing paradigm – a programmable computer that is accessible everywhere and to anyone and owned by millions of people globally. The digital asset ecosystem’s market value is US$2tn , led by Bitcoin at ~US$900bn and Ether at ~US$400bn. There are 200mn crypto users globally and ~US$125bn in transaction volume daily”.
Plan B’s (https://twitter.com/100trillionUSD) “Stock-to-flow” model also continues to show remarkable alignment with price and predicts a Bitcoin price of over $150,000 by the end of the year.
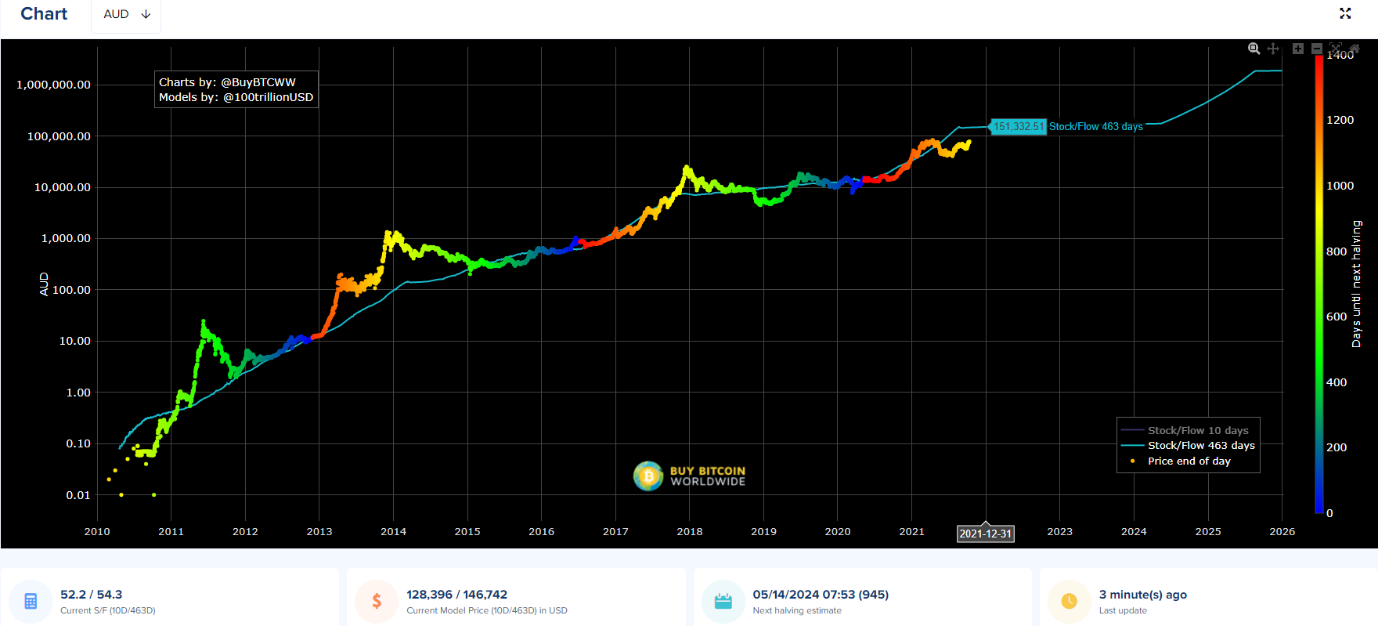
Source: https://stats.buybitcoinworldwide.com/stock-to-flow/AUD
Stock-to-flow (S2F) considers the current stock of Bitcoin (total amount currently available) against the flow of new production (Bitcoin mined). It is often used to model scarce commodities such as silver or gold.
If demand continues to grow, then supply scarcity drives price. Bitcoin’s supply halvenings cut supply in half which typically coincides with a bull market cycle. As of writing, Bitcoin’s price is undervalued relative to the S2F model price.
On-chain data
On-chain data also supports the potential for significant shorter-term price appreciation. Glassnode’s Net Unrealized Profit / Loss (NUPL) shows the percentage of Bitcoin’s current market cap that is in profit (if the coins were to be sold today relative to the Bitcoin price at the last time those coins moved).
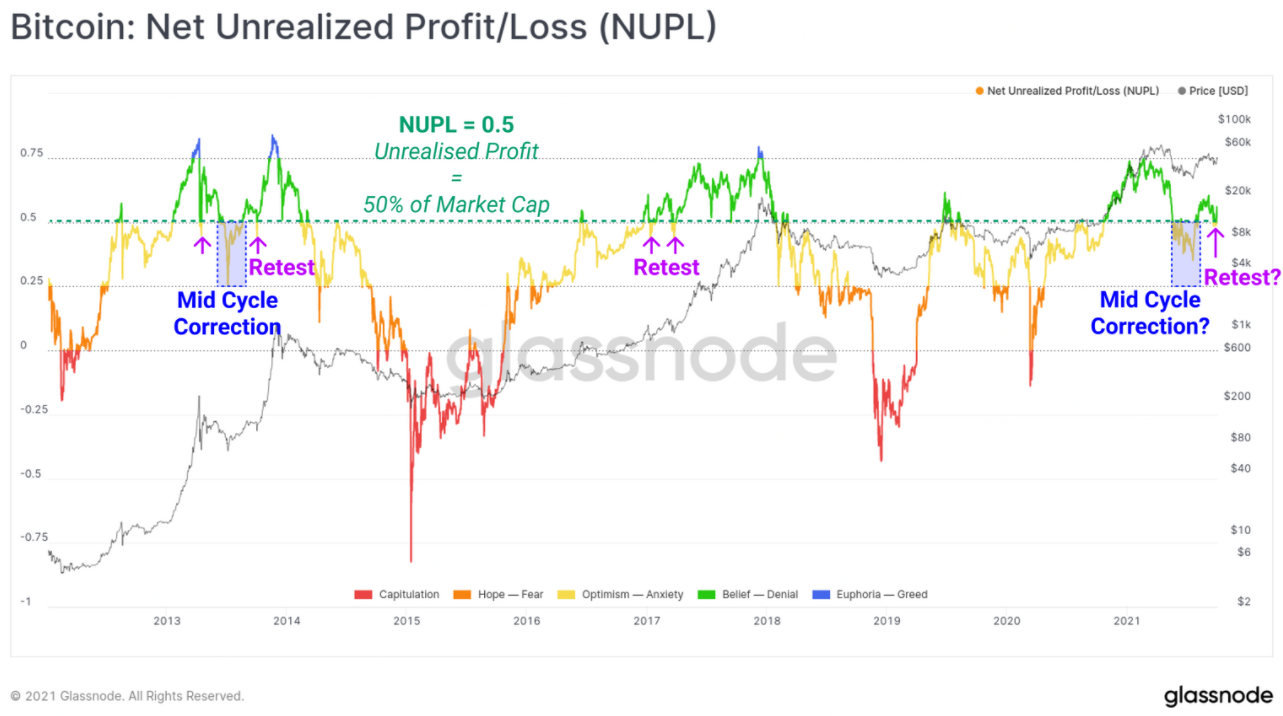
The chart shows that over half of Bitcoin’s market cap is showing an unrealised profit and that the 50 per cent mark recently acted as a support during a recent re-test. This metric provides a gauge to current market sentiment because NUPL bouncing off the 50 per cent mark indicates that the overall market’s conviction to hold onto unrealised profits is strong when tested. (Conversely, if NUPL were to fall below 50 per cent it might presage a market downturn as unrealised losses mount up).
This tendency to bounce off the 50 per cent support line also occurred during the previous two bull market cycles following the 2012 and 2016 halvenings and could be a pointer to continued momentum through the current cycle.
Bitcoin enthusiasts are “hodling” ("Hold On for Dear Life" – a strong conviction to hold Bitcoin) and “stacking sats” (“Satoshi’s” being one millionth of a Bitcoin) and hoping that the recent price action continues through the predicted cycle into 2022. Traders or investors looking to catch the wave might consider making their move while the macro and on-chain metrics continue to show momentum.


Frequently Asked Questions about this Article…
Bitcoin's price has been on a roller-coaster ride, dropping from an all-time high of $A84,000 in mid-April to $40,000 in mid-July, and then climbing back to around $77,000. This volatility is typical for Bitcoin, and historical patterns suggest it could rise significantly if it follows past trends.
Bitcoin's 'halvening' cycle, which occurs approximately every four years, reduces the block reward for mining Bitcoin transactions by half. Historically, this event has been followed by significant price increases, as seen in the cycles following the 2012, 2016, and 2020 halvenings.
Low interest rates, fiat currency debasement through quantitative easing, and growing regulatory clarity are strong macroeconomic tailwinds for Bitcoin. Statements from US Federal Reserve Chairman Jerome Powell and SEC head Gary Gensler have also contributed to a positive outlook for Bitcoin.
The Stock-to-Flow (S2F) model compares the current stock of Bitcoin to the flow of new production. It is used to model scarce commodities like gold and silver. According to the S2F model, Bitcoin's price is currently undervalued, and it predicts a price of over $150,000 by the end of the year if demand continues to grow.
On-chain data, such as Glassnode’s Net Unrealized Profit/Loss (NUPL), indicates that over half of Bitcoin’s market cap is in unrealized profit. This metric suggests strong market sentiment and conviction to hold Bitcoin, which could point to continued momentum in the current cycle.


