Portfolio Updates July 2019: 'And there was much rejoicing'

We get the feeling that markets right now resemble that scene from Monty Python and the Holy Grail – “and there was much rejoicing” – the ‘excitement’ is far ‘deafening’ even as markets ratchet ever higher.
Of the 23 MSCI developed equity markets, 5 of them made new record all-time highs and closing highs in July, while another 6 were with in 2% of their respective all-time highs.
Yet there wasn’t really any major rejoicing when markets breached these levels. The most unloved bull market in global history is rolling on as more and more investors are being left behind in a wall of cash.
Interestingly, the ASX was one of these markets, finally breaking the 1 November 2007 record high on July 30. However, as an aside, we here at InvestSMART aren’t all too interested in that capital record; we’re more interested in total return records.
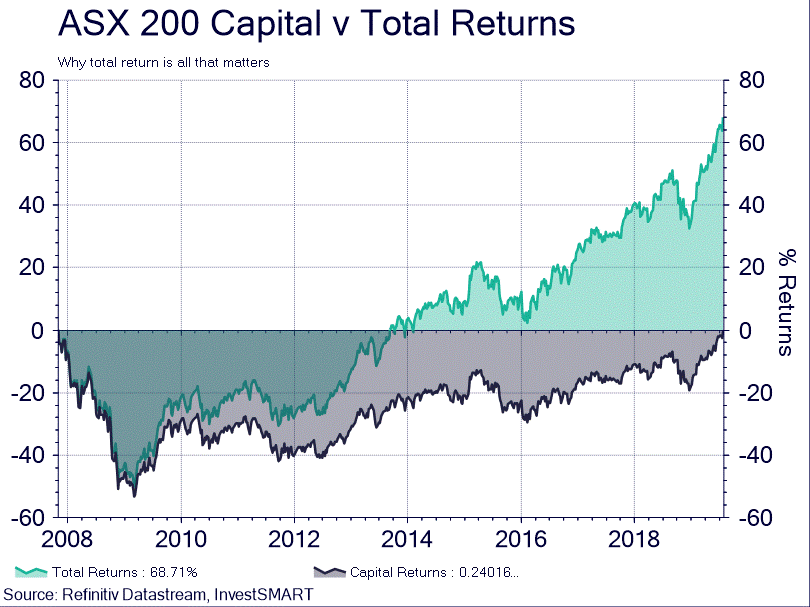
Have a look at this chart, which perfectly illustrates why total returns should be your major focus:

The chart shows that if you were the unluckiest investor in the world and bought the ASX at the top of the day on 1 November 2007, then you finally broke even on July 30 on a capital basis. However, if you reinvested from November 1 and concentrated on total returns, then you would have broken even in 2013. As of July 30, you would have been up almost 69%. Food for thought.
Equities are not the only markets making record all-time moves. Bond markets have also been smashing records.
In July, the Australian 10-year bond yield made a new record low of 1.18%. European bonds moved further into negative yield territory to register new record lows, the most notable countries here being Germany, France, the Netherlands, Belgium and all the Scandinavian countries.
We need to single out a couple of regions here. Every single bond in Denmark’s yield curve turned negative in July. You can now get a Danish 20-year bond (their longest dated bond) for -0.1%. With the European Central Bank likely to cut rates in September, Denmark will not be the only country with every single bond on offer moving into negative territory – Germany is next, mark my words.
Then there is Ireland, a country that was part of the PIIGS (Portugal, Ireland, Italy, Greece and Spain) acronym during the Eurocrisis of 2011/12, a country that was on the verge of defaulting on its debt in 2012 when its 10-year bond yield hit a staggering 14.6% in August of the same year.
Compare that to July 2019 where it just made a record all-time low of 0.03%. Theory would suggest Ireland is now as ‘safe as houses’, but we don’t think that’s necessarily true. However, this does highlight the flow of funds into anything ‘risk-adverse’ and how far down the unconventional monetary policy path Europe has gone in the search for ‘whatever it takes’.
The question is, why? Why are growth assets, particularly those of the equities variety, powering on? Is there more to the moves in the bond market than just global economic slowdowns? And is cash really dead?
In short, July really has been the top of the climax of a thematic that has been playing out in global markets since December last year, which is the forthcoming cycle of global monetary policy easing.
It truly is a global story. The Reserve Bank of Australia followed its June cut with a further 25-basis point cut at its July meeting. The European Central Bank, although it didn’t move on monetary policy in July, did outline a suite of policy changes likely to be enacted at its next meeting in September including cuts to the main deposit rate and the reintroduction quantitative easing (this mainly explains why most European countries have negative bond yields). The Reserve Bank of New Zealand is likely to cut the cash rate in August, and even the Bank of England is shifting its view to possibly easing policy in the near future.
However, the biggest development in the central bank world was the Federal Reserve cutting the Federal Funds Rate for the first time in 3878 days (10.6 years). It’s the second-longest streak in its history, the record being between mid-1942 to February 1954. The initial reaction, interestingly, was a negative one, as the market had priced in harder, faster, stronger cuts from the FOMC and more ‘dovish’ commentary.
Instead it was greeted with a bumbling chairman having to clarify answers and explain why the Board was cutting in the first place. We don’t expect that to happen again, instead, we expect that once the dust settles from the July meeting then markets will continue to trade on the premise of further cuts from the FOMC. Already October is being seen as the next likely meeting for the FOMC to bring out the scissors.
All this ‘excitement’ illustrates why we design our portfolios to smooth out volatility from such events. All our diversified portfolios have a certain percentage allocated to defensive assets, such as fixed income and cash, that act as a buffer and smooth out market gyrations. This percentage varies depending on your risk profile, with the more risk adverse you are, the higher the weighting to defensive assets.
However, over the past 8 months, defensive assets have boomed. Particularly the bond market. In fact, bonds have returned on a capital basis over 8.5%, exactly the kind of return one expects in equities, not fixed interest.
This increase in capital value, however, has impacted yield returns as discussed earlier. Some view this as a sign the world is becoming a more ‘uncertain’ place. However, that’s not the only interpretation, as it also means that markets see borrowing rates ‘lower for longer’.
No developed economy on the planet has long-dated bond yields above their 2007 levels. That suggests the market believes interest rates are unlikely to see upward pressure for a decade or more. This should give borrowers confidence that debt repayments will remain low to take on more investment risk in their business, growth programs etc.
On the flipside, low cash rates are killing cash as an asset. The average term deposit across the timeframe of 1-12 months is approximately 1.75%. Inflation currently sits at 1.6%. In real terms, cash is returning just 0.15% per annum. That is treading water stuff.
We reduced our cash holdings across all portfolios in July from 2% of the total portfolio to 1% to allow for better returns from other asset classes. We would also highlight the earlier chart around total returns as another reason to move out of cash. Cash is simply not an asset that will grow and return like its peers. In a market where cash is being squeezed, that gap in returns will get ever bigger as time moves on.
Diversified Portfolios
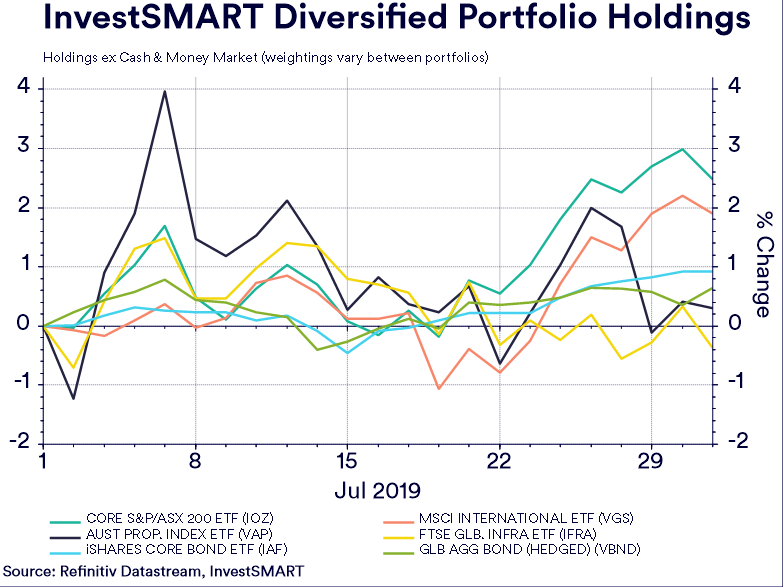
Individual capital performance of the securities held by the Diversified Portfolios, with weightings varying depending on risk appetite.

- Added 1.43% after fees in July as growth and defensive assets surged
- Domestic equities attributed 0.36%, International Equities, 0.46% fixed interest 0.27% and domestic property 0.24%
- All facets of the portfolio contributed to the portfolio
- Added 1.89% after fees in July as growth and defensive assets surged
- Domestic equities attributed 0.70%, International Equities, 0.81% fixed interest 0.24% and property 0.14%
- All facets of the portfolio contributed to the portfolio
- Added 2.42% after fees in July on the record prints in equities
- Domestic equities attributed 0.87% while International Equities attributed 1.18%
- All facets of the portfolio contributed to the portfolio
- Added 2.83% after fees in July on the record prints in equities
- Domestic equities attributed 1.15% while International Equities attributed 1.67%
- All facets of the portfolio contributed to the portfolio
Satellite Portfolios
- Added 3.46% after fees in July on the record prints in global equities
- S&P 500 (IVV) attributed 1.71% while the global holding VGS attributed 1.66%
- All facets of the portfolio contributed to the portfolio
- Added 0.75% after fees in July as bonds saw strong capital inflows
- Treasuries attributed 0.52% while floating rate notes attributed 0.23%
- All facets of the portfolio contributed to the portfolio
- Added 2.69% after fees in July as property jumped in interest rate cuts
- Domestic property attributed 0.62%, international property attributed 0.82% while TCL attributed 0.58%
- All facets of the portfolio contributed to the portfolio
Commentary by Portfolio Manager Alastair Davidson
- The total portfolio return was 0.62% for the month and 6.77% for the 12-month period. The total return of the portfolio is above its objective for all time periods measured. Since inception the total portfolio return is 5.56%, which is 0.99% over its return objective after fees.
- For a second time this year, the RBA dropped the official cash rates by 25bps to a record low of 1.00%, leading to a further rally in hybrid prices. We see a continued investor appetite for asset classes outside of cash in order to generate sufficient income returns.
- July is usually a low-income month with only one security trading ex-distribution. The total income return (gross) was 0.04% for the month and 1.23% for the quarter, whilst the income return since inception is 5.23% p.a.
- Strong investor demand has continued across all the portfolio names. Our strategy is to retain our existing positions and consequently there was no rebalancing of the portfolio over the period.
- Trading remains suspended in Axcesstoday (AXLHA). The administrator announced on 9 August that it had reached agreement with a potential buyer for some assets of the Group. It is unclear what return will be available to the Note holders. The position will continue to be valued at cost.
Feeling the squeeze on your term deposits? Click here to read our article on how a balanced portfolio could help.
For more information on our Diversified Portfolios, click here.
Frequently Asked Questions about this Article…
Despite several markets reaching all-time highs, there hasn't been much excitement because many investors are still holding onto cash and missing out on the bull market. This has been termed the 'most unloved bull market in global history.'
Focusing on total returns is crucial because it accounts for reinvested dividends and interest, which can significantly enhance overall returns. For instance, if you had invested in the ASX at its peak in 2007 and focused on total returns, you would have broken even by 2013 and seen a 69% increase by July 2019.
Bond markets have been breaking records with yields reaching new lows. For example, the Australian 10-year bond yield hit a record low of 1.18% in July, and many European countries have moved into negative yield territory.
Interest rates are expected to stay low because no developed economy currently has long-dated bond yields above their 2007 levels. This suggests that markets believe borrowing rates will remain low, encouraging investment and growth.
Low cash rates are diminishing the attractiveness of cash as an asset. With average term deposits yielding around 1.75% and inflation at 1.6%, real returns are minimal, making cash less appealing compared to other asset classes.
InvestSMART's diversified portfolios performed well in July 2019, with returns ranging from 1.43% to 2.83% after fees, depending on the risk profile. All facets of the portfolios, including equities, fixed interest, and property, contributed positively.
In July 2019, InvestSMART reduced cash holdings across all portfolios from 2% to 1% to enhance returns from other asset classes, given the low returns on cash.
The article suggests that global monetary policy is entering a cycle of easing, with central banks like the Federal Reserve, Reserve Bank of Australia, and European Central Bank either cutting rates or planning to do so, which could influence market dynamics.


