Nuts and Bolts: What is Volatility


Does the above definition of volatility hold true for investment markets? To some degree yes, as markets can be ‘unpredictable’ and can change ‘rapidly’. But market volatility is more than just observing the swings market movement. It is the statistical measure of a market or security’s dispersion from the norm.
In a lot of cases, volatility can be described using the bell-curve theory as to how many standard deviations away from the norm it is at that point in time.
.png)
As the curve shows, volatility can swing in either direction, both positively and negatively, not just negatively as the definition implies.
The rule of thumb for a market to be describe as ‘volatile’ is for it to rise and fall more than one per cent over a continual period of time. This higher volatility leads to increased uncertainty or risk and sees the size of changes in a security or market’s value widen.
For example BHP’s share price under a period of low volatility may only move 20 to 50 cents in a daily session. But let’s say there is an event that causing BHP to experience some volatility, that 20 to 50 cent spread now becomes $1 to $3 a session. Meaning that it could move from $30 a share to $27 or $33 in one day in higher volatile time versus $29.50 or $30.50 a day in lower volatile time.
Volatility is expressed in several ways, but the two most common ways are historical and implied volatility.
Historical Volatility
Historical volatility is a gauge of the fluctuations of underlying security or market by measuring price changes over predetermined periods of time.
So for example, here is the historical volatility of the ASX 200 as of February 8 2022
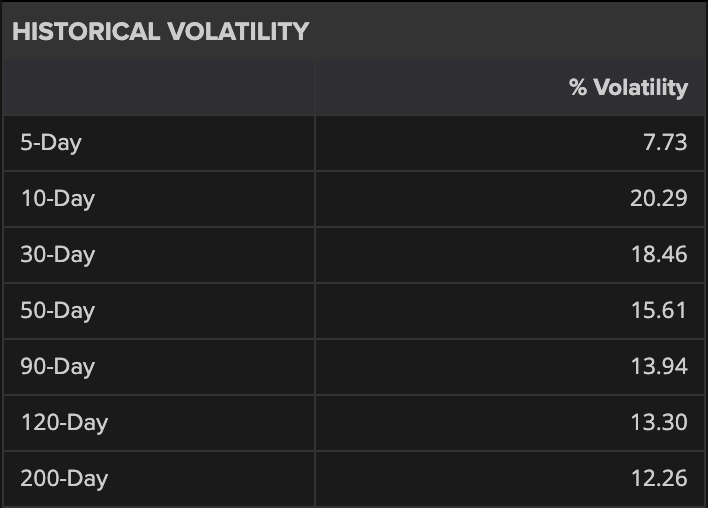
(Source: Refinitiv Eikon)
As the table shows volatility has risen and fallen over a 50-day period going from 15.6 to 20.3 before falling to 7.7. This meant the ASX 200 daily points move was more than normal during the period historical volatility was rising. However, it has since fallen suggesting the uncertainty has abated and daily movements are returning to normal.
Historical volatility is generally calculation based on intraday, intraweek intramonth changes (i.e. the high and low of period), can also be based on the change from one closing price to the next.
However the issue with historical volatility is that it is just a representation of the past, and has no real input into how future events could transpire, something market participants such as option traders need. This is where implied volatility comes in
Implied Volatility
Volatility is hugely important to options trading as options are affected by time. An options trader needs to work out how volatile the market could be over the life of the option they are using. Therefore, they use implied volatility to make an informed decision of just how volatile and high risk the market could be going forward.
Implied volatility gives options trader a way to calculate the probability of a volatile event, as the risk of said event is priced in the option they are buying or selling.
It short it represents the expect volatility of the future.
Let’s use BHP example again, if volatility was expected to be high, the cost of a BHP option would be expensive due to possibility BHP’s share price could move up or down above what would be considered normal.
Conversely if volatility was expected to be low the price of the BHP option would be cheap as the risk of BHP’s share price moving strongly up or down is considered a low possibility.
It must be noted here that implied volatility is not a certainty it’s a prediction or an estimate of the potential for an event. Thus, implied, and historical volatility could be vastly different at the same point in time. This is because traders past performance is not an indicator of future performance. Instead, they have to estimate the potential of the future risk in the option that is on market.
The conclusion from all over this is that volatility is just a normal part of markets and by extension investing. What both historical and implied volatility show is that sometime in the future volatility will happen.
Thus the most prudent measure to guard and ride (remember volatility is also to the upside) bouts of volatility is:
- Diversify your portfolio,
- Understand what level of risk you are comfortable to hold
- And that over time volatility with dissipate and the long-term gains of being in the markets will override any short-term swings you experience.
Next week we'll explore how you can see current volatility compared to historical volatility via the volatility index, the VIX.
If you're retired or approaching retirement you may be interested in Paul Clitheroe's Planning for Volatility When You're Retired.
Frequently Asked Questions about this Article…
Market volatility refers to the statistical measure of a market or security's dispersion from the norm. It is often described using the bell-curve theory, indicating how many standard deviations away from the norm it is at a given time. Volatility can swing both positively and negatively, and a market is typically considered volatile if it rises or falls more than one percent over a continual period.
Historical volatility measures the fluctuations of a security or market by analyzing price changes over predetermined periods. It reflects past market behavior. Implied volatility, on the other hand, is used by options traders to estimate future market volatility. It represents the expected volatility and helps traders assess the risk of future events.
Implied volatility is crucial for options trading because it helps traders estimate how volatile the market could be over the life of an option. This estimation allows traders to price in the risk of potential volatile events, influencing the cost of options. High implied volatility suggests a higher risk of significant price movements, making options more expensive.
Yes, historical and implied volatility can differ at the same time. Historical volatility is based on past market data, while implied volatility is a prediction or estimate of future market behavior. Since past performance is not always indicative of future outcomes, these two measures can show different levels of volatility simultaneously.
Market volatility affects stock prices by increasing the range of price movements. During periods of high volatility, stock prices can experience larger swings, both upwards and downwards. For example, a stock like BHP might see its price move from $30 to $27 or $33 in a day during high volatility, compared to smaller movements in less volatile times.
Investors can manage market volatility by diversifying their portfolios, understanding their risk tolerance, and focusing on long-term gains. Diversification helps spread risk across different assets, while knowing your risk tolerance ensures you are comfortable with potential market swings. Over time, the long-term benefits of investing typically outweigh short-term volatility.
No, market volatility is not always negative. While it can indicate risk and uncertainty, volatility also presents opportunities for gains. It can lead to price increases as well as decreases, allowing investors to potentially benefit from upward swings in the market.
The VIX, also known as the volatility index, measures current market volatility compared to historical volatility. It provides investors with insights into expected future volatility, helping them make informed decisions about their investments. The VIX is a useful tool for understanding market sentiment and potential risk levels.


