Managing the global market slowdown


Summary: There are two key market indicators that will ring the bell signalling a rebound – either the 50-day trend line moves above the 250-day one or the Coppock curve turns north after falling into negative territory – watch for them in the weeks ahead. |
Key take out: Controlling emotions during share market dips is difficult, but employing market timing techniques can provide some scaffolding for decision making for longer term planning. |
Key beneficiaries: General investors. Category: Shares. |
It's now been almost a year since the Australian share market last peaked. Between April 27 2015 and February 12 2016, the All Ords index fell by 19.1 per cent.
In Europe, Japan and China, the falls after April 2015 exceeded 20 per cent – the plunge line for measuring a crash. Markets have jumped since their lows of February 2016, but except for America these are still well below their highs of a year ago.
So, happy birthday Mister Bear!
The US share market looks like its doming rather than recovering. America is important because it accounts for over half of the world's stock market capitalisation.
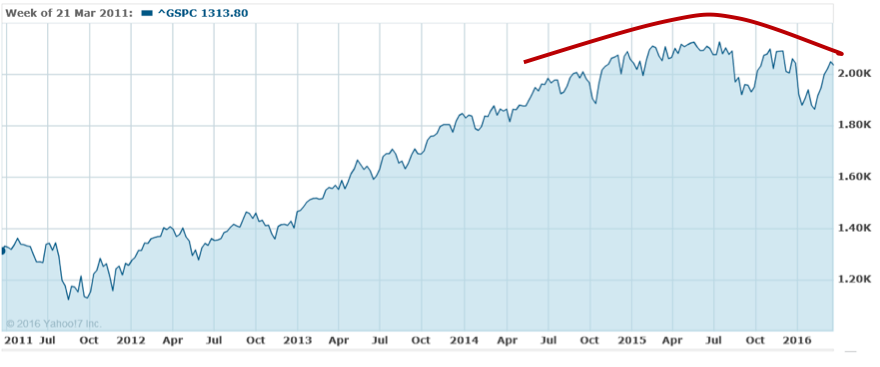
Source: Yahoo Finance
The S&P 500 share index has run out of puff because US pre-tax earnings dropped 3.1 percent in 2015, the most since 2008. The decline in the December quarter was 7.8 per cent, the most since the first quarter of 2011 (too see more on this, click here). Earnings are being weighed down by weak productivity, rising labour costs and the plunge in energy prices.
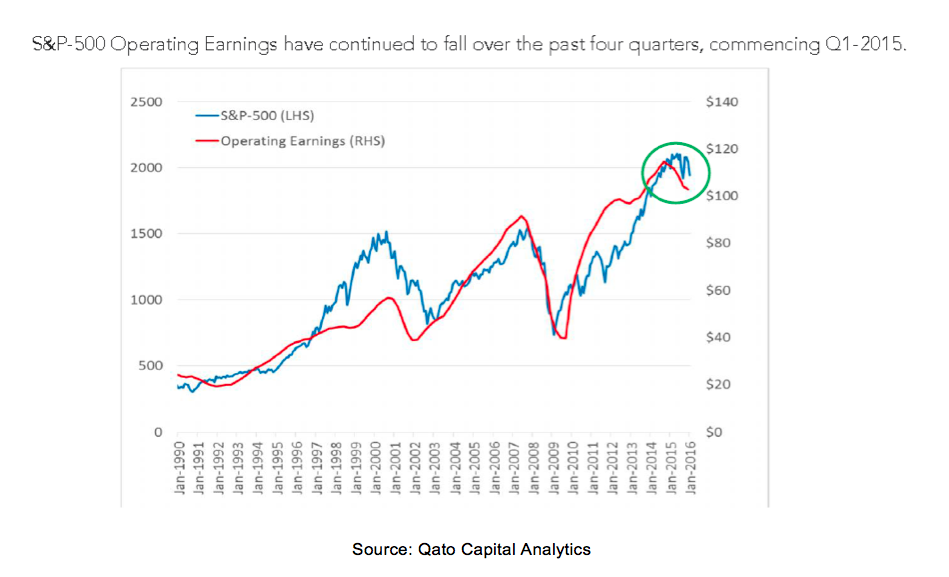
Source: Qato Capital Analytics
The all-world share market index is swooning even more strongly than America's index because Japan and Europe are on the brink of recession while China risks a hard landing.
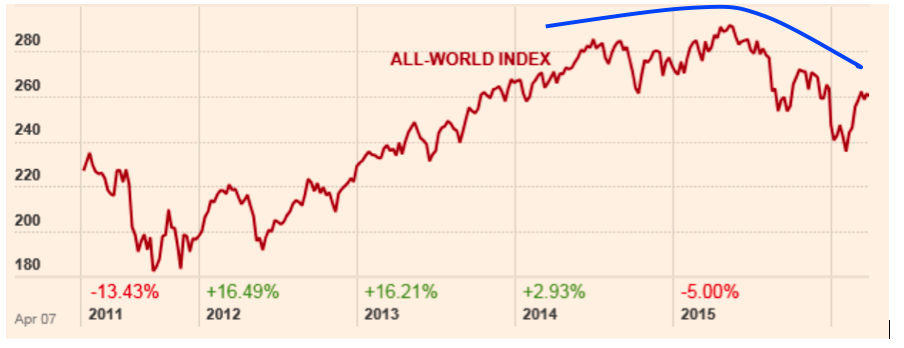
Source: http://markets.ft.com/
Nevertheless, between the February 12 and March 14, share markets around the world regained some confidence and enjoyed a bounce, though they have come off slightly since. See for instance what has happened to the Australian All Ords share index:
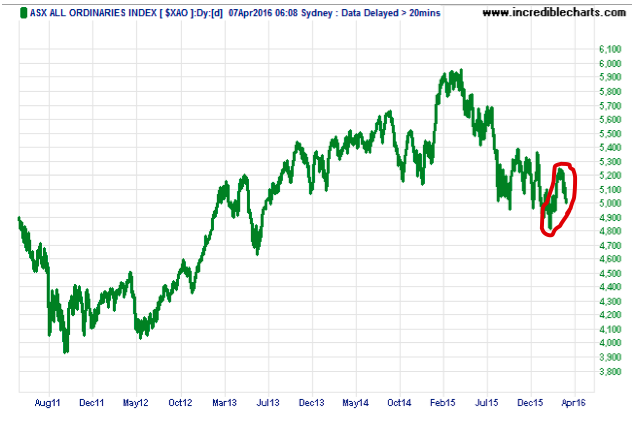
As I advised last July (read my piece here: Riding out a rough patch, July 7 2015) applying a simple 50 by 250 day trend-lines crossover strategy to the All Ords index would have meant exiting an Australian share market equity fund (such as the SPDR S&P/ASX 200 ETF) on August 17 2015 and being in cash since.
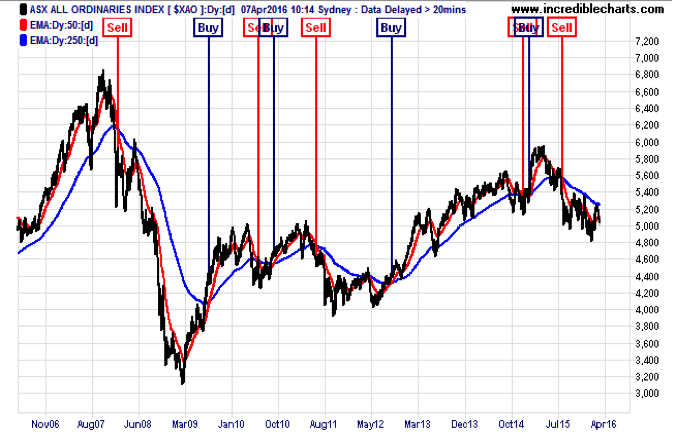
The question now is when to re-enter the share market by buying back a listed equity fund at a lower price than it was sold for last August?
Using the above trading model, the answer is simple – get back into an equity fund when the market's medium term (50 day) trend line crosses above its long term (250 day) trend line.
But is there a better way? The answer is yes, and it involves using the Coppock indicator, which has an excellent track record of ringing the bell early when a bear market is over.
This “very long momentum indicator”, as its inventor Sedge Coppock described it, was disclosed in Barron's Magazine on October 15, 1962. For the technically minded, it is the sum of a 14-month rate of change and 11-month rate of change of the stock market index, smoothed by a 10-period weighted moving average. Fortunately professional charting software (such as www.incrediblecharts.com) provides this indicator so you don't have to do the maths yourself.
The logic behind the indicator makes fascinating reading. According to Wikipedia:
Coppock, the founder of Trendex Research in San Antonio, Texas, was an economist. He had been asked by the Episcopal Church to identify buying opportunities for long-term investors. He thought market downturns were like bereavements and required a period of mourning. He asked the church bishops how long that normally took for people, their answer was 11 to 14 months and so he used those periods in his calculation.
A buy signal is generated when the indicator is below zero and turns upwards from a trough. No sell signals are generated (that not being its design). The indicator is trend-following, and based on averages, so by its nature it doesn't pick a market bottom, but rather shows when a rally has become established.
Now the good news is that for the entire 35-year history of the All Ords share index (created when separate state stock exchanges merged to form the Australian Stock Exchange), Mr Coppock's indicator has accurately called the end of each bear market. See chart below.
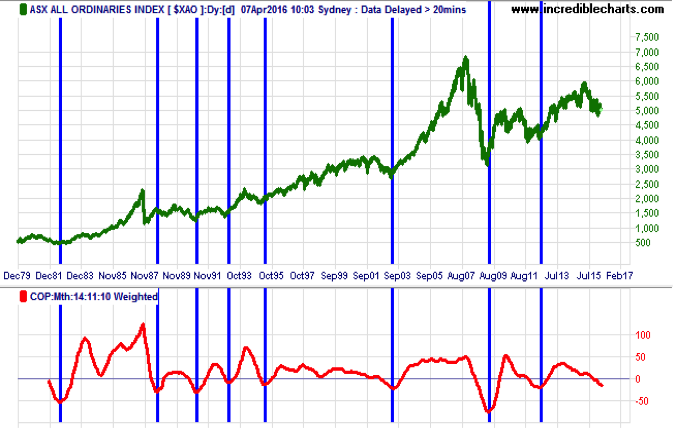
Its track record in other countries is also good, though not as near-perfect as in Australia. When it comes to grieving Australian investors and Episcopalian widows clearly have something in common.
So whichever bell rings first – either the 50-day trend line moves above the 250-day one or the Coppock curve turns north after falling into negative territory – heed it to re-enter the share market knowing that the worst should be over.
If you had followed Mr Coppock's indicator in 2009 (as I did), you would have bought a listed share fund on May 7 that year instead of having to wait for when the 50-day trend line crossed the 250 day line on August 19. See chart below.
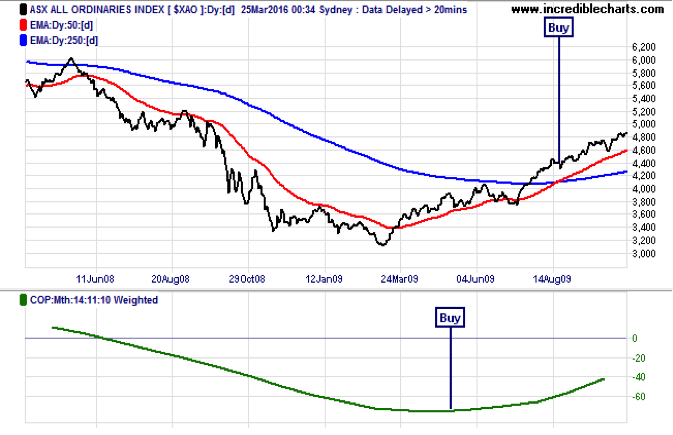
How many investment analysts signalled May 7 2009 as the end of the “bereavement period” for the financial meltdown of 2008? Most investors were too traumatised by the 55 per cent crash in the market over the sixteen months to early March 2009 to get back into shares.
Investment advisers say “its time in the market, not timing the market” that counts. But controlling our emotions during share market cycles is easier said than done.
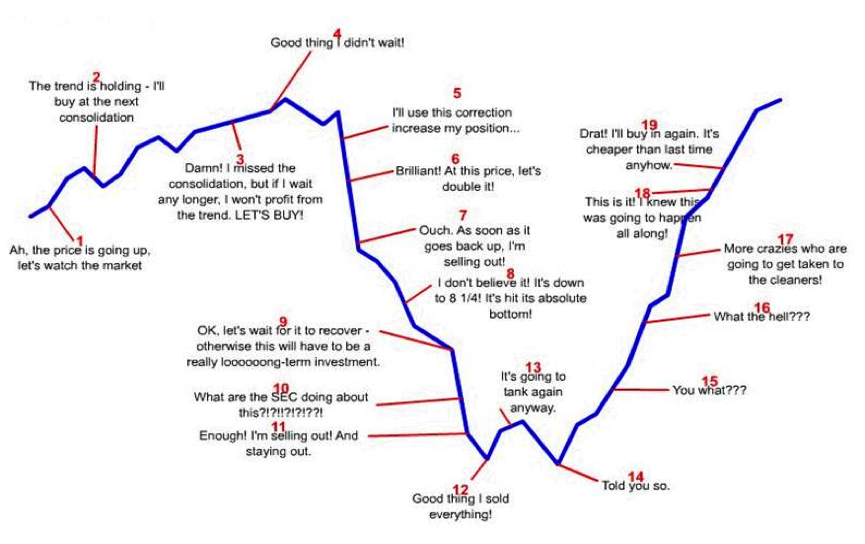
Using a reliable directional system such as a trend lines crossover strategy and a proven momentum oscillator such as the Coppock curve can help gauge when it's safe to be in an exchange traded equity fund and when it's not. That's market risk management. The alternative is the share market roller coaster ride of investor emotions as depicted below.
Typical investor reactions to winning and losing on shares
Percy Allan is Editor of MarketTiming.com.au. For a free three week trial of its newsletter and trend-trading strategies for listed ETF funds see www.markettiming.com.au.


