Looking beyond America's falling emissions
Reuters
Both European Union and US carbon emissions have fallen sharply over the past five years, but working out whether that will continue requires teasing out short-term and one-off factors, and pinpointing lasting efficiency gains.
Some causes are temporary or one-off: clearly, over the last several years energy demand was lower as a result of the financial crisis; while the weather can have a large impact, including a mild 2011-2012 winter in the United States.
The US shift to natural gas from coal, as a result of the shale energy revolution, has a few years to play out but will taper off and so could be seen as a medium-term factor.
Two trends are longer term: first, a shift towards renewable power, especially in the EU for the rest of this decade, and also in the United States if costs continue to fall; and second, a trend towards more energy efficiency.
Continuing, falling emissions have implications for fossil fuel demand, and where driven by efficiency, for competitiveness.
They may also allow developed countries to offer modest targets to curb greenhouse gases at long-running UN-backed climate talks, and so keep these ticking over.
The long-term trend for global greenhouse gases – and for expected climate change – will depend on emerging economies and how far investment in energy efficiency and low-carbon energy balance spending in oil and coal.
Peaked
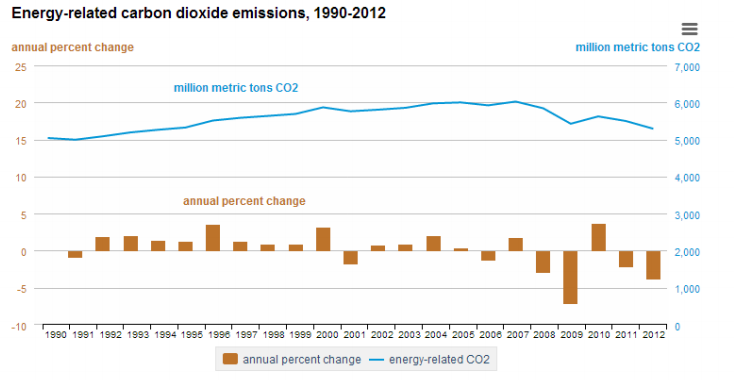
US carbon emissions reached an 18-year low last year, the US Energy Information Administration (EIA) government data body said last week, in its report: US Energy-Related Carbon Dioxide Emissions, 2012.

Carbon dioxide emissions have fallen in five out of the last seven years, and are now 12 per cent below their highest level in 2007, suggesting that they may have peaked.
Most of the falls in the past five years were due to slower economic growth and a switch to natural gas and renewable power from coal.
Significantly, last year emissions fell even as the economy grew strongly, by 2.8 per cent, and the biggest single factor was a decline in energy consumption, rather than a switch from coal to gas, according to the EIA.
In the European Union, greenhouse gas emissions including CO2 peaked three decades ago before east European countries switched to liberalised market economies, crushing their industrial output as a result.
More recently, emissions were flat until a sharp fall in 2007 as a result of the financial crisis and a shift to renewable power.
Energy intensity
Carbon intensity of energy supply is a measure of the emissions per unit of energy, and will be much lower in an economy powered by natural gas rather than coal.
Energy intensity measures the amount of energy consumed per dollar of economic output, and reflects the efficiency of and share of heavy industry in the economy.
The main reason for last year's drop in US emissions was a decline in energy intensity.
Together, falls in energy and carbon intensity offset the effects of a rising population and higher economic output.
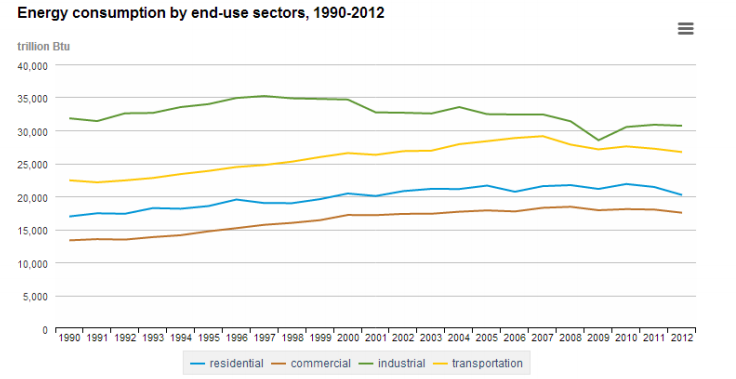
Energy consumption fell for both short and long-term reasons.
The biggest cause was a one-off, a mild winter through March last year, accounting for half the decline.
The value for heating degree-days (which measures the average temperature difference below a relatively warm benchmark) fell 20 per cent compared with the decade average.
But there were also efficiency gains.
Grid and generating efficiency reduced electricity system losses sharply last year (by 4.8 per cent).
And more efficient vehicles reduced road transport emissions even as the number of miles travelled was unchanged.
EIA data show US road transportation energy consumption is on a firmer downward trend than any other sector (compared with residential, commercial and industrial).

Renewable energy
In the last five years one of the dominant factors in falling US CO2 emissions has been the shift from coal in the electricity supply, whose carbon intensity fell 13 per cent from 2007 to 2012.
A shift to natural gas as a result of the shale energy revolution accounted for about two thirds of a drop in carbon intensity, and renewable energy the rest, according to the EIA.
Both trends may continue, with renewable power taking over in the longer term.
In the EU, emissions have fallen faster over the past four years among installations participating in the EU emissions trading scheme, compared with the rest of the economy (by 12 per cent compared with 7 per cent).
Sectors including cement, iron and steel were more affected by the financial crisis than those outside the EU ETS, such as agriculture and transport.
In addition, a shift to renewable power cut fossil fuel demand in the energy combustion sector, the European Environment Agency said two weeks ago.
"Achieving emission (cuts) in the non-ETS sectors appeared more difficult," it said in its report, Trends and projections in Europe 2013.
Future
The trend towards renewable power is certain to continue in Europe.
Net power generating capacity will rise by 250 gigawatts over the next decade, of which 220 GW will be from renewable sources, according to the European Network of Transmission System Operators for Electricity.
In the United States, that trend is less sure, but there is strong impetus towards energy efficiency.
As the EIA said on Monday: "Specific circumstances such as the very warm first quarter of 2012 and the large increase in natural gas-fired generation relative to coal contributed to the significant decline in emissions in 2012. Other factors, such as improvements in vehicle fuel efficiency and increased use of renewable generation, however, could play a continuing role in subsequent years."
It should be noted that the EIA has cut its long-term US CO2 emissions forecast (25 years ahead) in each of its last three annual energy outlooks.


