Keeping electricity demand in check
National Electricity Market update to March 2013
During the first two weeks of March, south east Australia experienced a prolonged spell of exceptionally hot weather. Consequently, March 2013 was the first month since November 2011 to record an increase in annualised demand in the NEM, albeit, very small ― 0.01 per cent.

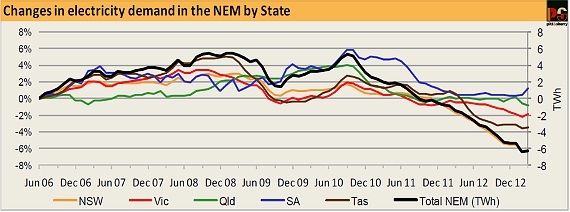
Victoria and SA were the two states where the heatwave was hottest and longest, and the effect of this on electricity consumption is easy to see in the graph above.
While electricity demand bucked its dropping trend in the face of heatwave conditions, emissions intensity, continued to decline. Annualised coal-fired generation was almost unchanged from February. It was supply from gas, hydro and wind generation that continued to increase and meet the increased demand.

Among the coal-fired power stations, one unit at Wallerawang in NSW stayed off-line, as did two units at Tarong in Queensland, but all four units at Yallourn in Victoria were operating, and Northern, in South Australia, kept operating up to the end of the month.
Peak demand for summer 2012-13 in Victoria was recorded on March 12, while in SA, March 12 was the third highest peak of the summer. The events of that day provide a good illustration of how well the NEM is able to respond to large changes in demand.
Up until midday, brown coal electricity was being exported to both NSW and SA. Those flows stopped suddenly when the energy was needed in Victoria. In New South Wales, increased output from the Snowy and some of the coal generators easily made up for the lost supply form Victoria. In SA, gas-fired generation fulfilled the same role. In Victoria, further energy, on top of the withdrawn exports from brown coal generators, was demanded and the necessary boosts to supply came from hydro generation in both Tasmania and the Snowy.
In total, the peaks occurred at virtually identical times in Victoria and SA, around 4.30pm eastern time, and were almost exactly twice the preceding overnight minimum demand.
Wind generation in the four states remained fairly steady throughout the day, contributing between 3 per cent and 5 per cent of total demand. Variations in wind output were completely dwarfed by the size and rapidity of the changes in demand. Pool prices stayed well below $100 per MWh, and mostly below $70 per MWh, in every state except Victoria, where it rose above $2,000 between 2.00 and 2.30pm, and above $200 between 4.00 and 4.30pm.
The Energy Sector is the largest source of Australia’s greenhouse gas emissions. The energy use covered by the Cedex accounts for about 80 per cent of Australia’s total energy combustion emissions, and 54 per cent of total emissions (excluding land use change and forestry), as reported in the National Greenhouse Gas Inventory. Figure 8 below illustrates the growth in energy sector emissions, with the lines at the right showing the period and emission sources covered in the CEDEX.
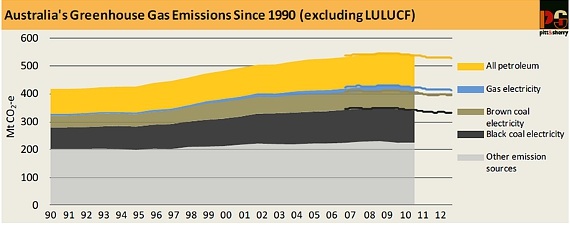
Increases in energy combustion have caused more than 90 per cent of the increase in total emissions since 1990. Trends in energy emissions are a reliable indicator of Australia’s ability to achieve emissions mitigation and hold the key to reducing emissions as a whole.
Total energy emissions to December 2012
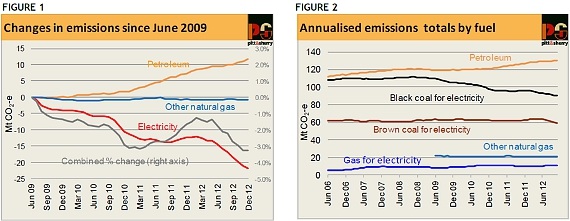
Total emissions continued to fall and, for the year ended December 2012, were 2 million tonnes CO2-e lower than they were in the year ended September 2012. The established pattern of the last three years continued, with falling electricity generation emissions more than offsetting strong growth in emissions from petroleum fuels, while emissions from non-electricity natural gas use were almost unchanged.
Petroleum, including special analysis of road transport fuels (new)
Ever since Cedex started it has been recording steady growth in consumption of petroleum fuels, and associated emissions, interrupted only by a shallow and short lived slowdown in the first half of 2009. This trend continues, apparently unabated (Figures 1 and 3).
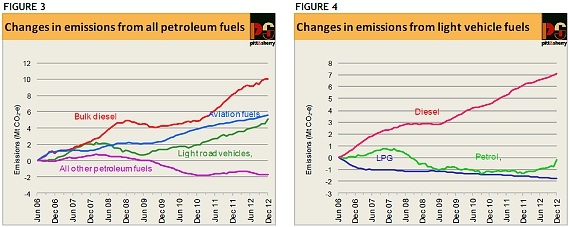
Past CEDEX reports have drawn attention to the particularly rapid growth in consumption of bulk diesel fuel (defined as sales not made through retail fuel outlets) and the probable importance of mining activity as a driver of this growth. However, non-transport uses account for less than 40 per cent of total diesel consumption (calculated from Australian Energy Statistics), so other factors must also be important.
Statistics on road transport activity and fuel consumption, published by the Bureau of Infrastructure, Transport and Regional Economics, confirm that this is indeed the case. The data indicates that, over the six years from 2005-06 to2011-12, diesel fuel consumption by articulated trucks increased by 26 per cent, and that heavy trucks and buses account for over one third of total bulk diesel consumption. Overall, consumption of bulk diesel increased by 31 per cent over the six years and the total increase in emissions was 10.1 Mt CO2-e. Heavy road freight traffic is clearly a major contributor to growth in bulk diesel consumption and associated emissions.
Consumption of aviation fuels grew even more quickly ― by 40 per cent ― over the same period. However, total volumes are less than diesel volumes, so the corresponding increase in emissions, 5.6 Mt CO2-e, is somewhat less. Transport statistics show that this growth in consumption is consistent with the growth in total passenger kilometres travelled by air.
The third major category of petroleum fuel consumption corresponds broadly to fuel used by cars and light commercial vehicles; it comprises all petrol, automotive LPG and sales of diesel through retail outlets. When this emissions category is broken into its three components, a very clear picture emerges (Fig. 4). Consumption, and associated emissions, from both petrol and automotive LPG have fallen slightly, while consumption of diesel has grown strongly. Nevertheless, use of petrol still contributes 68 per cent of emissions in this category. Consequently, in this light vehicle category emissions from diesel have increased by no less than 65 per cent, yet total emissions have increased by only 4 per cent and total emissions by 1.1 Mt CO2-e over the six years to June 2012. Although the shift to diesel engine cars is now a well recognised trend, the roadtransport statistics suggest that light commercial vehicles have contributed about two thirds of the total increase in diesel consumption and cars only about one third. This reflects two facts: a shift from petrol to diesel vehicles and growth in light commercial travel (measured as vehicle kilometres travelled), growth that has been significantly faster than car travel. In fact, the transport statistics suggest that car transport fuel consumption has increased by less than 1 per cent over the six year period, while fuel consumption by light commercial vehicles has increased by over 14 per cent. In volume and emission terms, the absolute growth in light commercial transport is four times greater than the absolute growth in car transport. These trends present major challenges for both transport and emissions policy.
Finally, the fourth category of petroleum fuel consumption, which covers other petroleum fuels used to supply non-transport (stationary) energy, contributes only about 5 Mt CO2-e to annual emissions, and has fallen by about 2 Mt CO2-e from a high in 2007. The Australian energy economy is in the final stage of a process, running since the late 1970s, in which use of petroleum fuels as a source of thermal energy (heat) in stationary uses has been progressively replaced by natural gas (and greater energy efficiency).
Natural gas
Data on the direct use of natural gas (as opposed to use for electricity generation) have only been available since 2009. Since then, consumption, on average, has declined gradually, and this trend is continuing (Figures 1 and 2). Improved energy use efficiency is likely to have also played a role in both the manufacturing and residential sectors. Over the past few years, although price rises have been less than for electricity, gas prices have risen significantly. Higher prices are therefore likely to be another factor affecting demand for gas. It is also worth noting that the gas consumption data available for CEDEX excludes all consumption in WA and the NT, which has risen strongly with growth in LNG production and other mining and mineral processing activities. The gas consumption data also exclude gas used in eastern Australia at gas processing plants, such as those at Longford and Moomba. At present this consumption is quite modest, but when the new LNG plants at Gladstone, in Queensland, start operating, this source of gas consumption will grow appreciably.

