It's Wall Street I'm worried about
Summary: After big falls at the start of 2016, the question becomes whether global markets are in a prolonged bar market, or can soon be expected to rebound. The Australian market is approaching the bottom of its historic range, and could perhaps present a good buying opportunity if it manages to hit the lowest historical bands. GuruFocus finds Australia has the second best outlook for future returns after Singapore, while the US ranked second worst in the same analysis. |
Key take out: According to technical analysis, the Australian market is close to the bottom – but Wall Street looks like it will experience further falls. |
Key beneficiaries: General investors. Category: Shares. |
In early January, the Royal Bank of Scotland (RBS) forecast that 2016 would be a "cataclysmic year" with major stock markets falling by a fifth and oil prices possibly hitting $US16 a barrel.
The bank's credit team warned that its market stress test was flashing the same danger signal that it did before the failure of Lehman Bros in 2008. It advised clients to: "Sell everything except high quality bonds. This is about return of capital, not return on capital. In a crowded hall, exit doors are small."
From early May 2015 to early February 2016, the Financial Times All-World Share Index fell almost 20 per cent, which would signal a crash. Only the rebound in the last fortnight has stopped it from qualifying as a bear market.
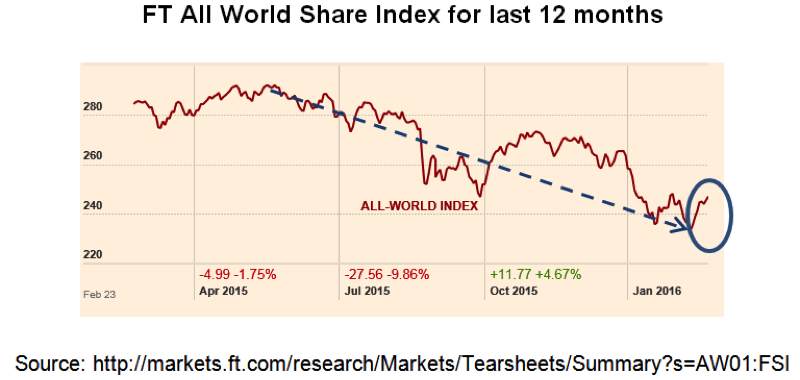
But the underlying story is not as sanguine. Here's a chart showing the maximum decline in major share market indices since their last peak. As can be seen, all markets except the USA and UK were in bear territory by February 12, 2016. America, representing over half of global share market capitalisation, has prevented the All-World share index from slipping into a bear market.

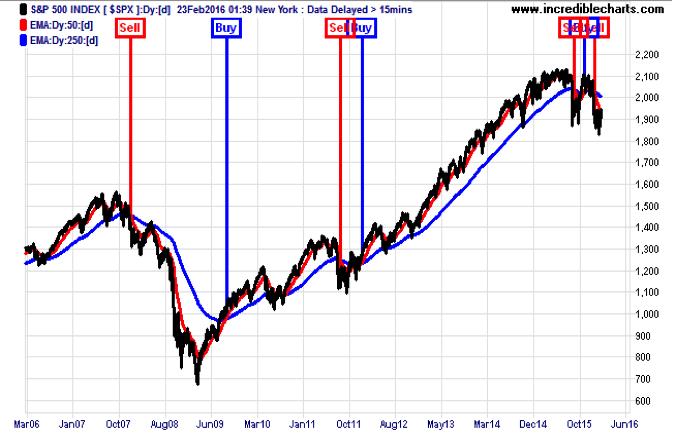
Anyone using the stock-market trend-following strategy I discussed previously (Read Riding out a rough patch, July 7 2015, and Ignore emotion, look at trends, August 15, 2015) would have exited the Australian share market when its medium term (50 day) trend line crossed below its long term (250 day) trend line on August 18, 2015. See chart below.

Notice how such a strategy would have largely escaped the 2008 and 2011 crashes, but got slightly whipsawed in the 2010 and 2014 corrections
Anyone trading the American market using the same trend line crossover model (Read more here: Why Wall Street matters more than ever, January 18, 2016) would have exited US shares on the January 11, 2016.
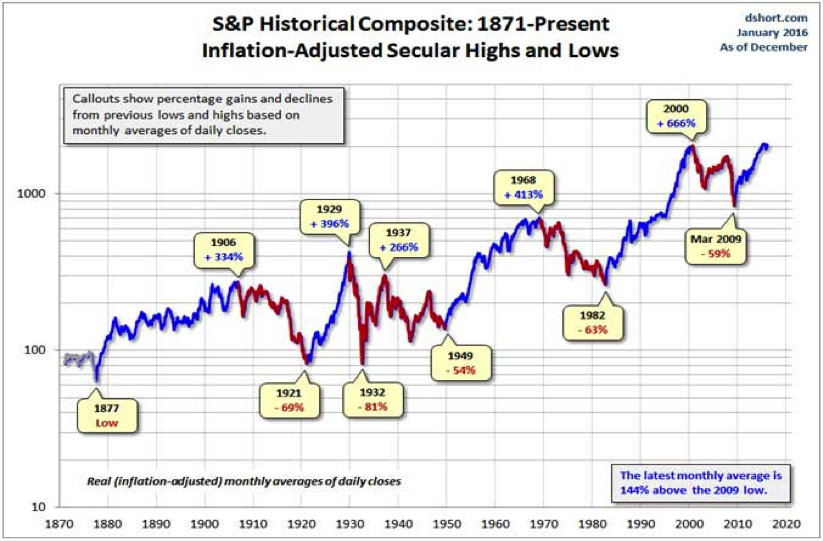
The question is whether stock markets are now in a secular (i.e. prolonged) bear market, or just experiencing a rude shock (like 2011) before resuming the secular bull market that started in March 2009.
The following chart is a history of secular bull and bear markets in America from 1870, when the New York Stock Exchange displaced the London Stock Exchange as the barometer of world investor sentiment. The chart is done on a log scale to avoid distortions since using an arithmetic scale would overstate current index values and understate historic ones.
Here's another view of the S&P500 index since 1988, also shown on a log scale.
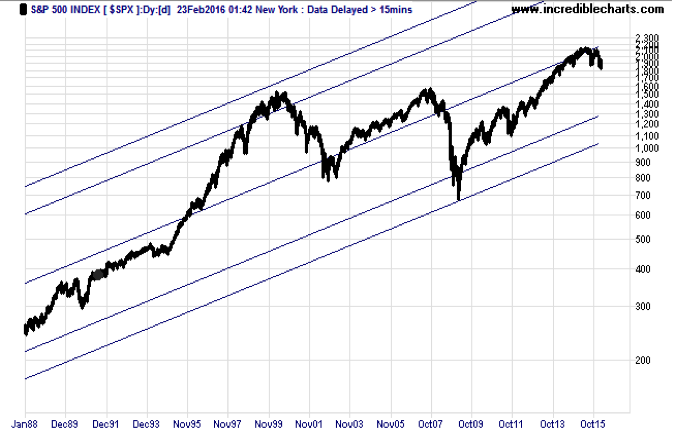
Notice that on this measure the American stock market is now slightly below its long term middle trend-line, which would suggest it has further to fall if it's in a bear market like that of 2000 and 2008. A saving grace is that any fall in the index would not be from the upper stratosphere it reached in 1999.
Here's a similar log scale presentation of the Australian All Ords index:
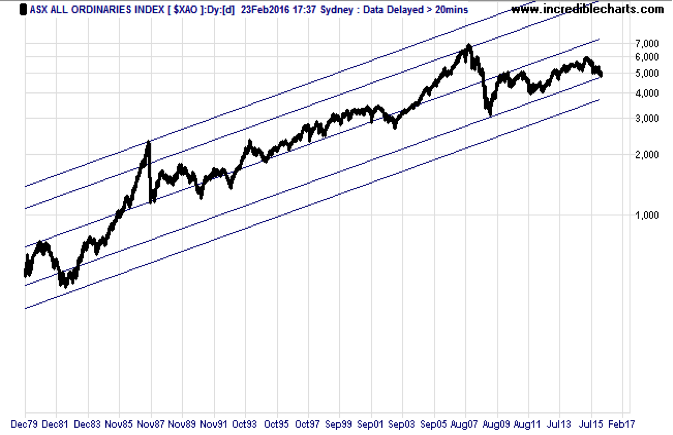
Notice how Australia's stock market is presently towards the bottom of its long-term channel range. It's not yet within the subterranean band of that range, but it's touching its ceiling as it did in early 2009. Should it penetrate this lower band as it did in 1982, it would offer a rare buying opportunity.
So on a technical basis Australia's share index is near its historic depth, while America's index has further to fall if it's in a bear market like the rest of the world.
But how do both markets fare on fundamentals?
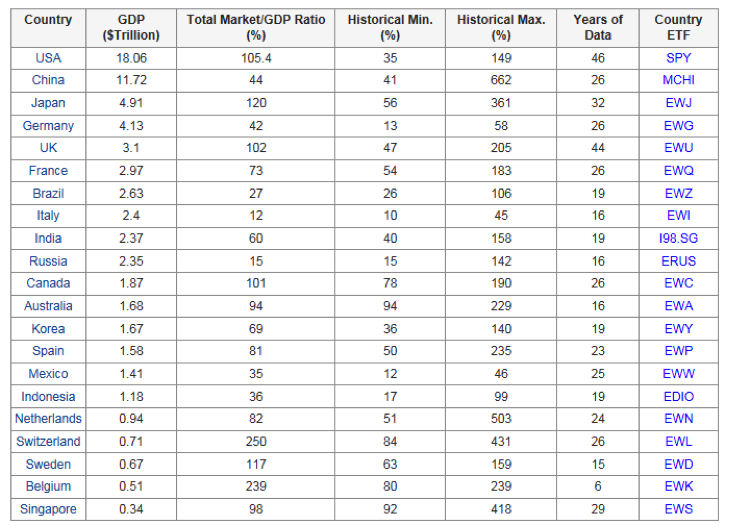
Warren Buffet's favourite measure of a market's intrinsic worth is its capitalisation to GDP ratio. The next chart shows how the world's largest economies in descending size each rate on their total stock market value to GDP.
Note how Switzerland (250 per cent) and Belgium (239 per cent) have overshot the comparable ratios of other countries while Italy (12 per cent) and Russia (15 per cent) are depressed. America (105 per cent) and Australia (94 per cent) are above the ratios of most countries.

Source: GuruFocus
But the best comparative indicator is each country's past range for its own capitalisation/GDP ratio as shown in table below. The USA at 105.4 sits slightly above the midpoint (92) of its historical ratio range. But Australia, at 94, sits at the bottom of its historic range, though its database covers only the last 16 years compared with America's 46 years.
Source: GuruFocus
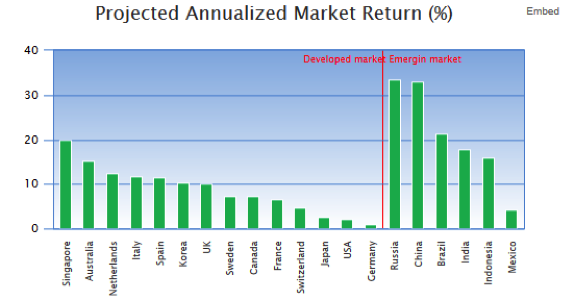
GuruFocus says the total returns of each share market in future will come from three factors: GDP growth, dividend yield and change of overall market valuation. By assuming each of these three contributions revert to mean over the next eight years, GuruFocus projects the average annual total return for each market up to 2023 will be as depicted in the following chart.
Source: GuruFocus
Leaving aside emerging markets (“whose implied returns carry much higher uncertainty”), GuruFocus finds Australia's share market as having the best total return prospects after Singapore. By comparison America has the second worst outlook. GuruFocus claims this method of calculating future returns has worked remarkably well in the past.
So once the 50 by 250 day trend-line crossover strategy says it's safe to get back into Australian shares, we will have the comfort of knowing that according to fundamentals the ASX is the second best place in the developed world to invest in a indexed equity fund (such as the SPDR S&P/ASX 200 share fund, STW). And an indexed emerging markets fund (such as iShares MSCI Emerging Markets share fund, IEM) might deserve a look too, notwithstanding its higher risk.
In the meantime, how bad could this crash get? Based on technical and fundamental analysis Australia is close to its market bottom whereas America has a lot further to fall if the bear market persists.
But logic doesn't always prevail. If America went into recession or China had a hard landing, Australia's share index would no doubt fall further. On the other hand if commodity prices (especially oil) stabilised (either because of central bank or oil cartel intervention) global share indices could climb back into bull territory.
So the safest course of action is not to second-guess what the market will do next, but to gauge its actual moves using trend and momentum analysis. That way one can be confident of going with the market's flow rather than against it.
Percy Allan is Editor of MarketTiming.com.au. For a free three week trial of its newsletter and trend-trading strategies for listed ETF funds see www.markettiming.com.au.


