InvestSMART Portfolios - October in Review


Invest smarter with capped fees: An Australian first
We know even the smallest difference in fees can result in substantial differences to your nest egg. Therefore under our new Professionally Managed Account service, we have capped our fees.
Simply look out for the 'Capped Fees' label. Find out more.
Market Drivers for the Diversified Portfolios
Both the Core Growth and High Growth celebrated its 4th Bday in October.
It was a savage month for global markets. US markets in particular were hit hard and at one point on track for their worst month since March 2009. However, they steadied and closed out the final few days solidly to limit the damage. It ended up being the worst trading month since mid-2011, with the Dow losing 5.1%, S&P sliding 6.2%, and the NASDAQ dropping 9.4%.
Looking through the intra-month volatility to the historical data, and what gives us confidence as longer-term value investors is that US markets, on average, experience a correction (a 10% or more move) once a year. This goes all the way back to 1900. Better still, fewer than 20% of these corrections turn into bear markets. Furthermore, US equities have delivered positive returns for 28 out of the last 37 years, or 75 per cent of the time.
We think October created an opportunity for longer-term international exposure.
The ASX was also caught up in the October rout and technically corrected if we take the August 29 high to the October low, which marked a 10.4% loss. Again, for the ASX as well, there are positives to be taken from October. On average, the ASX has experienced a correction every four years over the past twenty years. Over the same period, it has experienced a bull market (a gain of 20% or more) 5 times.
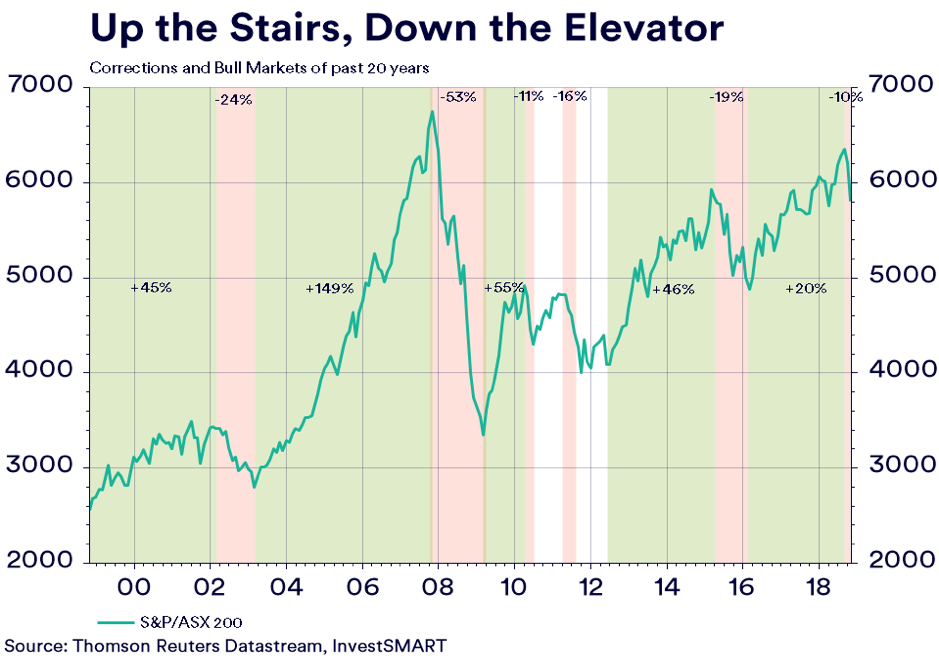
(Pink bars are the correction of the past 20 years, green bars are the bull markets of the past 20 years. Figures are the gains and loss during each period.)
The ASX also remains the highest yielding market of the 23 MSCI world markets, meaning, total returns remain a huge positive for the ASX overall. That means it will continue to be a solid investment market in the coming years.
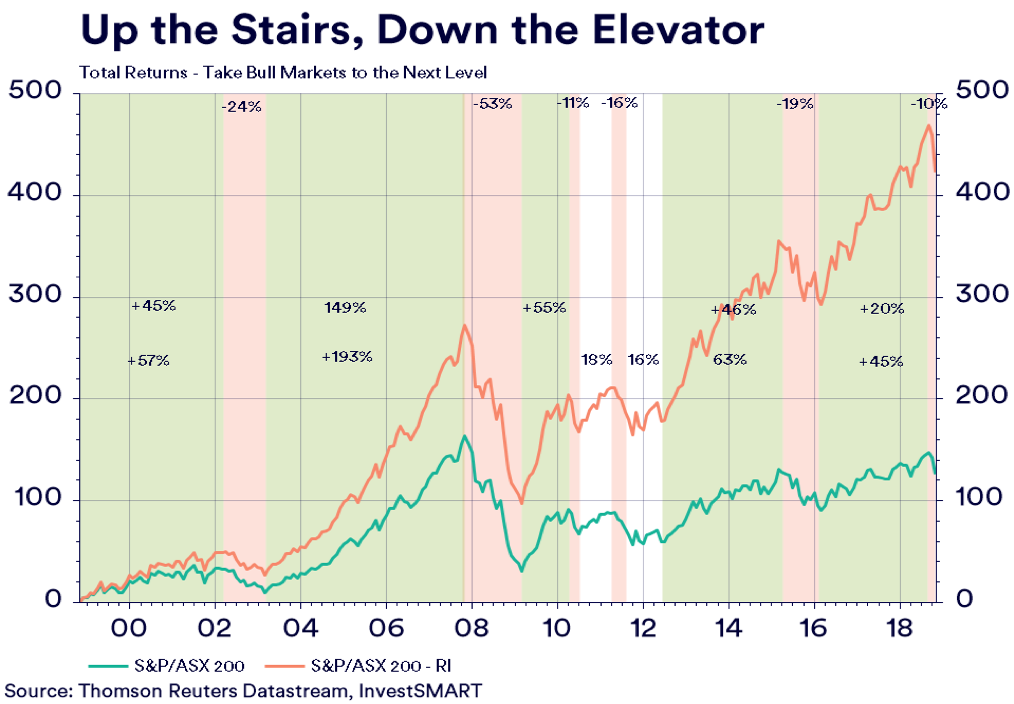
(Salmon line: total returns over the past 20 years, additional figures are the total return during each bull market)
October was also a perfect illustration of why one should never put all their investment ‘eggs’ into one ‘basket’. All asset classes found sellers in October, however, the capital erosion experienced in equities was far sharper than that we saw in cash and fixed interest.
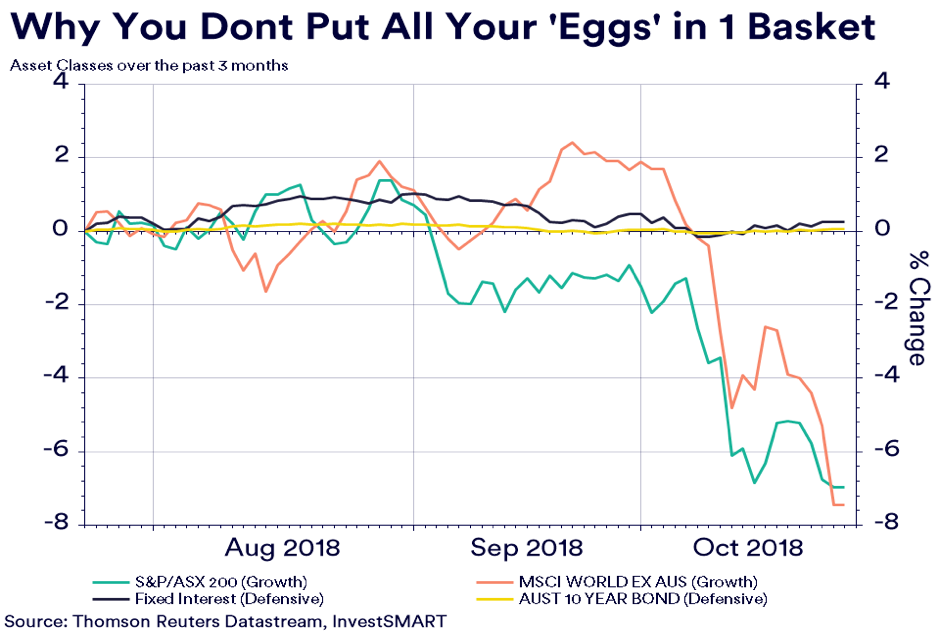
October is a great example as to why diversification should be core to any investment strategy. If you're looking for a diversified investment solution, view our Diversified Portfolios.
InvestSMART recently announced the introduction of capped investment fees, an Australian first. All of InvestSMART's Portfolios (excluding the Hybrid Income Portfolio) are part of our Capped Fee range. Starting at $99 p.a. for investments with a starting balance of $10,000, then capped at $451 p.a. for investments larger than $82,000.
To check your overall investment diversification, use our HealthCheck feature within InvestSMART's free Portfolio Manager.
Australian residential property fell further in October, declining 0.6% to be down 4.6% year-on-year. Drilling into the figures, and looking at the capital cities, it remains a tale of Sydney and Melbourne versus the rest.
Sydney fell 0.7% in October to be down 7.4% over the year, while Melbourne also fell 0.7% over the month to be down 4.7% over the year. Brisbane and Adelaide bucked this trend to be up on the month and the year. A caveat from the property data was rental income. Both commercial and residential rents actually rose according to the September quarter inflation read.
Global fixed income markets also faced headwinds in October as the US Federal Reserve all but confirmed December will see a further 25-basis point rise to the Federal Funds rate. The statement also showed that 2019 will likely see three, possibly four, more 25-basis point increases.
US 10-year Treasury yields hit 3.25% on this news. This spread into fixed income markets across the world, pushing markets lower. The Australian fixed income market, however, remained steady as the RBA held the cash rate at 1.5% for the 26th consecutive month. The RBA is showing no signs the status quo will shift over the coming 12 months. We expect Australian fixed income to outperform global peers as further selling in US bond markets is likely.
For more information on our Diversified Portfolios, click here.
Download Monthly Update PDF:
Diversified Income | Balanced | Core Growth | High Growth
InvestSMART International Equities Portfolio
The International Equities Portfolio celebrated its 4th birthday in October.
Since inception, the Portfolio has averaged a 10.3% per annum return and remains our best capital returning portfolio. However, as a high-growth portfolio, it is subject to a higher level of volatility and October took a toll on its monthly performance for it to decline 6.92%. We did expect some short-term volatility with events like the US mid-terms. Looking forward, November is traditionally very strong for cross-asset fund flows in the US (2.4 times more than any other month) and early trading in November suggests this trend is likely to continue.
To see more information on our International Portfolio, click here.
InvestSMART Diversified Property & Infrastructure Portfolio
The movement in the housing market did spill into Australian listed property, which was the largest drag on the property and infrastructure portfolio in October. However, as we noted above, rental inflation has held firm. This suggests the likes of Scentre Group, which is the largest holding in the Australian Property ETF, should mitigate the declines upon reporting.
Infrastructure remains mixed as its quasi-bond characteristics count against it in a rising yield market, something we believe will continue in the coming 12 months. The portfolio declined 1.57% in October.
To see more information on our Property & Infrastructure Portfolio, click here.
InvestSMART Interest Income Portfolio
Australian bond markets remain as solid as ever, with both floating notes and government bonds holding the line in October.
The RBA remains locked into a ‘no change’ scenario which has created a level of stability in the Australian bond market. The interest income portfolio added 0.49% in October, a trend we expected to flow through to November.
To see more information on our Interest Income Portfolio, click here.
InvestSMART Hybrid Income Portfolio
The Hybrid Portfolio returned -0.33% in October to be up only 0.95% for the quarter. The total return of the portfolio comes in below its objective for the month and quarter, but above for the half-year and full-year. The yield of the portfolio has risen to 5.5% (including franking) on the back of the falls in face value.
The best performers in October were CBAPF ( 0.3%) and CBAPE ( 0.2%). The main detractors were CGFPB (-1.1%) and WBCPH (-0.9%).
To see more information on our Hybrid Portfolio, click here.


Frequently Asked Questions about this Article…
Capped fees are a new feature of InvestSMART's Professionally Managed Account service, where fees are limited to a maximum amount. This means that even if your investment grows, your fees won't increase beyond a certain point, helping you save money and potentially grow your nest egg more effectively.
October was a challenging month for global markets, with US markets experiencing significant volatility. The Dow lost 5.1%, the S&P slid 6.2%, and the NASDAQ dropped 9.4%. Despite this, historical data shows that such corrections are common and often followed by recoveries.
Diversification is crucial because it spreads your investments across different asset classes, reducing risk. October's market volatility highlighted the importance of not putting all your investment 'eggs' in one 'basket', as different assets can perform differently under various market conditions.
Despite a 10.4% correction in October, the ASX remains a strong investment market, being the highest yielding among the 23 MSCI world markets. Historically, the ASX has experienced regular corrections but also frequent bull markets, suggesting potential for positive returns.
The International Equities Portfolio, despite averaging a 10.3% annual return since inception, faced a 6.92% decline in October due to market volatility. However, November is traditionally strong for US fund flows, indicating potential recovery.
The decline in the housing market affected Australian listed property, which was the largest drag on the Property & Infrastructure Portfolio in October. However, stable rental inflation suggests that some losses may be mitigated in future reports.
The Australian bond market remains stable, with the RBA maintaining a 'no change' stance on interest rates. This stability contributed to a 0.49% gain in the Interest Income Portfolio in October, a trend expected to continue.
In October, the best performers in the Hybrid Income Portfolio were CBAPF (0.3%) and CBAPE (0.2%), while the main detractors were CGFPB (-1.1%) and WBCPH (-0.9%). Despite a slight decline, the portfolio's yield has risen to 5.5%.


