InvestSMART Portfolios Monthly Update - May 2020


In May I presented the following charts to our investment committee. They show the ASX 200 and the S&P 500 from 20 February to 20 June 2020 versus the market reactions of both the ASX 200 and the S&P 500 during the Global Financial Crisis (GFC) and the 1987 flash crash.
These are two events that most in the investment world have seen as relatable to the COVID crisis.
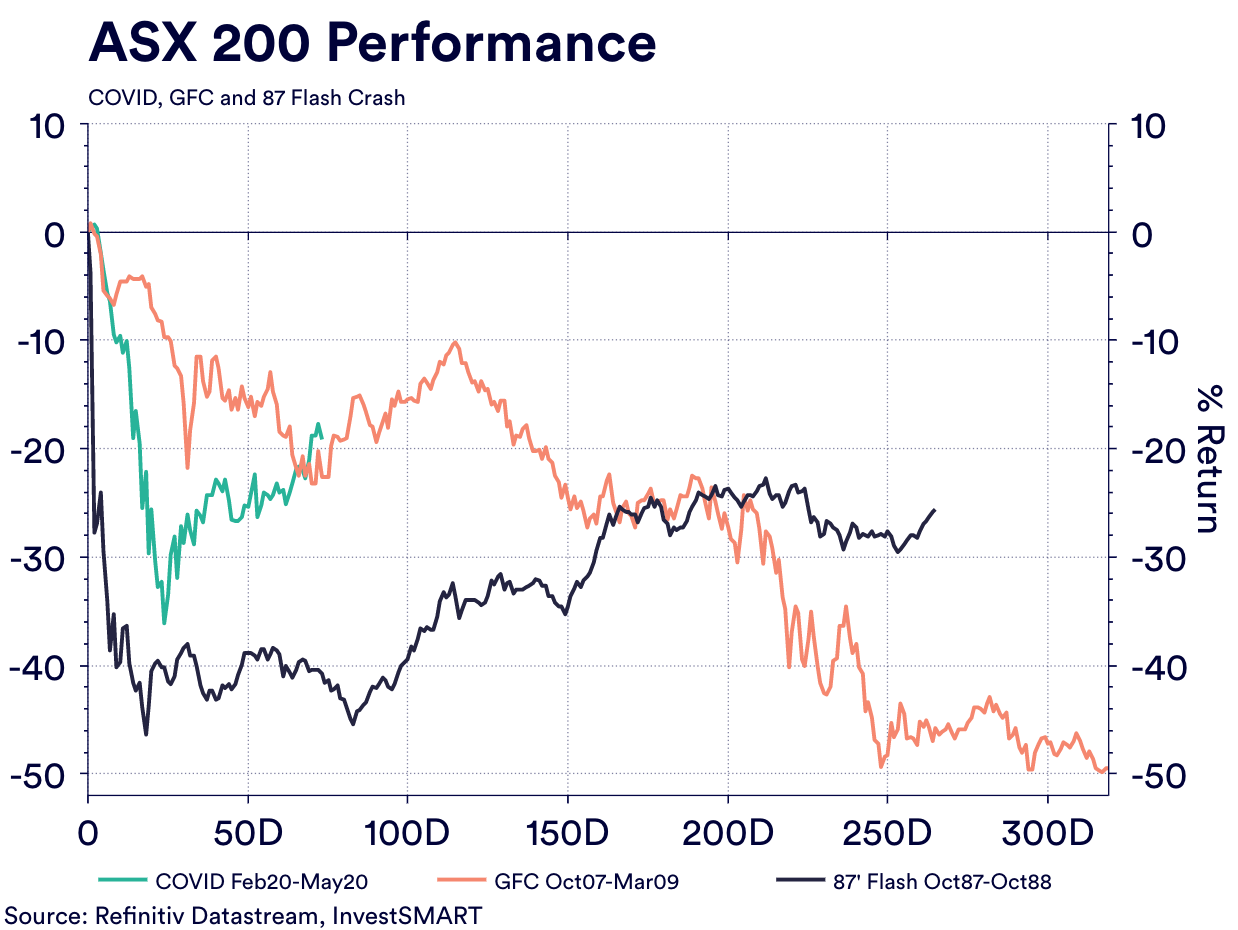

The conclusion from the comparison of these events shows that this event is like nothing anyone alive today has ever experienced and people are struggling to predict what the markets will do next.
However, there are some possible explanations and they are explanations that suggest the uptrend is likely to hold for the rest of the year.
‘Whatever it takes’ – central banks and central governments have learnt in the post-GFC world that policy intervention is not only tolerated by markets but is actively encouraged. Markets are flush with liquidity and investment returns only stack up in markets rather than asset classes such as cash.
This policy setting, in our view, has also brought the active versus passive investment debate to a head.
Why? Highly accommodative fiscal and monetary policy is a ‘blanket’ tool. Everything is ‘touched’, yes some more than others, but when you throw diversification into the investment mix, it smooths outs the haves and have nots to create a more even blend that drowns out the individual value of one investment.
Which got us thinking. In May we discussed the speed and scale of the market’s recovery, it literally has been ‘blink, and you missed it’. The continuation of that pace from May to May and even into the first week of June continues to catch investors and managers alike, off guard.
It has even seen a new market ‘term’ come about. We have all heard the old adage: ‘don’t catch a falling knife’. The new buzz phrase we have seen is: ‘trying to catch the tail of a helium balloon’. There is a fair point to this, investors continue to say they are ‘waiting for the pullback’ and are trying to actively ‘catch’ this market.
We have said time and time again this just won’t work. Time in the market will always outperform, and every day out hits your long-term performance, so trying to catch that helium balloon perfectly is clearly hurting your returns.
What is also interesting over this period is the performance of active management compared to passive.
According to the ASX there are 47 actively managed Exchange Trade Products (ETPs) offering an array of investment strategies and options. Looking at these 47 products, the average performance over the past month, year and 3 years is telling.
- 1-month average: 4.55%
- 1-year average: -5.29%
- 3-year average: 0.12%
Compare these numbers to the passive ETPs listed on the ASX of which there are 176.
- 1-month average: 6.00%
- 1-year average: -0.18%
- 3-year average: 4.84%
So even in this market where active managers will have been moving allocations and strategy, they have still underperformed passive managers. This is a trend that has been occurring over and over in the modern investment world.
It’s why we continue to see our capped fee portfolios as some of the best opportunities for investors as it removes that want to chase the helium balloon and instead gets investors to concentrate on their long-term goals.
Diversified Portfolios
- As equities continued to surge, the portfolio expanded 1.19% after fees in May which was in line with peers.
- All aspects of the portfolio attributed to performance with Domestic Equities ( 0.0.57%), International Equities ( 0.17%) and Property ( 0.34%) the biggest contributors.
- The yield on the Conservative Portfolio at the close of May was 2.62%.
- As equities continued to surge, the portfolio expanded 1.74% after fees in May which was in line with peers.
- All aspects of the portfolio attributed to performance with Domestic Equities ( 1.08%), International Equities ( 0.30%) and Property ( 0.29%) the biggest contributors.
- The yield on the Balanced Portfolio at the close of May was 3.06%.
- As equities continued to surge, the portfolio expanded 2.20% after fees in May.
- All aspects of the portfolio attributed to performance with Domestic Equities ( 1.37%), International Equities ( 0.45%) and Property ( 0.34%) the biggest contributors.
- The yield on the Growth Portfolio at the close of May was 3.42%.
- As equities continued to surge, the portfolio expanded 6.74% after fees in May.
- All aspects of the portfolio attributed to performance with Domestic Equities ( 1.83%), International Equities ( 0.64%) and Property ( 0.27%) the biggest contributors.
- The yield on the Growth Portfolio at the close of May was 3.79%.
Satellite Portfolios
- The portfolio expanded 0.75% after fees in May as the International Portfolio got hit by the surging Australian dollar.
- S&P 500 (IVV) attributed 0.41%, European Equities (VEQ) attributed 0.16% while the global holding VGS attributed 0.58%.
- All facets bar the Asian equities portion of the portfolio contributed to performance.
- Expanded 0.28% after fees in May.
- Treasuries attributed 0.09%, corporate fixed interest attributed 0.24% while cash was flat.
- All facets of the portfolio contributed to performance in May.
- The yield on the Interest Income Portfolio sits at 2.07%.
- The portfolio expanded 8.33% after fees in May.
- Domestic Property attributed 4.08%, International Property attributed 0.75%, TCL attributed 1.61% while International Infrastructure attributed 1.66%.
- The yield on the Property and Infrastructure Portfolio sits at 4.91%.
Commentary by Portfolio Manager Alastair Davidson
- The total portfolio return was 1.32% for the month including franking credits. The estimated running yield is over 5.0%, and estimated yield to call/maturity is 6.00% including franking credits.
- The total portfolio return was -0.59% and -0.21% for the quarter and 12-month periods respectively. Since inception the total portfolio return is 3.15% including franking credits, which is -1.16% under its return objective of the RBA Cash rate plus 3%.
- The trading prices of ASX-listed hybrids increased during May, though less so than April.
- The RBA maintained the cash rate at 0.25% in May, with no expectation of negative rates at this stage.
- There were 7 securities in the portfolio trading ex-distribution with payments expected in June.
- Macquarie Group launched a new hybrid (postponed from March) raising over $640 million with a higher margin than previously planned.
- The liquidators of AXLHA paid an interim distribution to Noteholders of $0.27 per Note in May. It is expected the total amount will be approximately $0.33 per Note
- At end of May the portfolio had a 4.94% allocation to cash.
For more information on our Diversified Portfolios, click here.


Frequently Asked Questions about this Article…
The ASX 200 and S&P 500 during the COVID-19 crisis showed unique market reactions compared to past events like the Global Financial Crisis and the 1987 flash crash. This event is unprecedented, making it difficult to predict future market movements.
Central banks and governments have adopted highly accommodative fiscal and monetary policies, which are actively encouraged by markets. These policies provide liquidity and support market recovery, influencing the active versus passive investment debate.
The phrase 'time in the market' is emphasized because trying to perfectly time market movements, like catching a 'helium balloon,' can hurt long-term returns. Staying invested consistently tends to outperform attempts to time the market.
Recently, passive investment strategies have outperformed active ones. For example, passive Exchange Traded Products (ETPs) on the ASX showed better average returns over 1-month, 1-year, and 3-year periods compared to active ETPs.
In May 2020, InvestSMART's diversified portfolios saw positive growth. The Conservative Portfolio expanded by 1.19%, the Balanced Portfolio by 1.74%, the Growth Portfolio by 2.20%, and the High Growth Portfolio by 6.74%, all after fees.
In May 2020, the International Equities portfolio expanded by 0.75% after fees, while the Interest Income portfolio grew by 0.28%. Both portfolios saw contributions from various asset classes, despite challenges like the surging Australian dollar.
The Property and Infrastructure portfolio expanded by 8.33% after fees in May 2020. Domestic Property, International Property, and Infrastructure investments all contributed positively to this strong performance.
The Hybrid Income portfolio returned 1.32% for May 2020, including franking credits. Despite a slight underperformance against its return objective, the portfolio's estimated running yield is over 5.0%, with a yield to call/maturity of 6.00%.


