CBA still leads the pack
| Summary: Which bank is getting the best returns? Mapping Commonwealth Bank’s most recent result against its three major bank rivals, CBA clearly comes up trumps. |
| Key take-out: CBA achieved the best profit growth, income growth, margin growth, and the best return on equity. |
| Key beneficiaries: General investors. Category: Shares. |
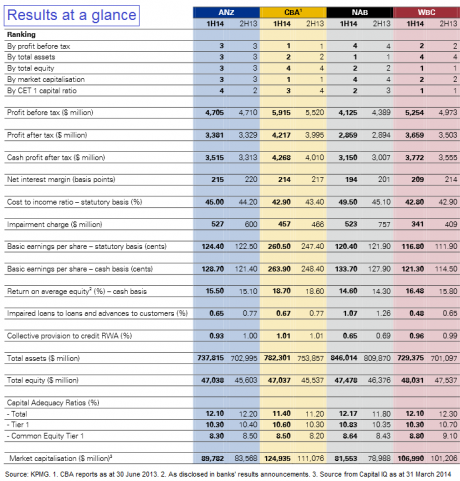
Commonwealth Bank’s performance was superior to its big bank rivals during the first-half of the financial year, based on several key measures. Although not directly comparable (CBA’s half-year ends on December 31, while for the other three banks it is March 31), CBA outperformed its rivals on profit growth, income growth, return on equity and margin growth.
The most significant factor in the improved cash earnings for the “Big Four” banks in the first-half of the financial year was a reduction in their charges for bad and doubtful debt.
Accountancy firm PricewaterhouseCoopers has calculated that 60% of the improvement in cash earnings in the half was driven by reduced bad debt charges.
NAB put in the best bad debt performance. Its impairment charge was half that of the previous corresponding period – down from $1.2 billion in March last year to $528 million in the latest half.
NAB chief executive, Cameron Clyne, said the big reduction was a result of the program to “de-risk” the bank’s lending portfolios.
Commonwealth Bank also reported a big reduction in bad debts, writing off $457 million in loan impairment expenses. This was down 26% on the previous corresponding period.
Westpac’s charge of $341 million was down 22% and ANZ’s charge fell from $599 million in March last year to $528 million in the latest half – a reduction of 12%.
On the basis of its de-risking program, NAB increased its cash profit by 8.5% over the previous corresponding period.
In terms of profit growth, CBA had the best result, increasing its cash profit by 14%. ANZ increased cash profit by 11% and Westpac increased its cash profit by 8%.
Looking at top-line income growth, CBA’s operating income was up 8%, ANZ’s was up 6%, Westpac’s up 5% and NAB’s up 2.6%.
One of the weak spots was an increase in costs. In a separate assessment of the big banks, KPMG said the big banks’ cost-to-income ratios went up an average of 116 basis points.
KPMG said: “Strategic initiatives to improve productivity, greater levels of offshoring, simplification of operating models and disciplined investment spending will continue to be priorities.”
Westpac’s operating expenses rose 6% over the previous corresponding period, while its cost-to-income ratio rose from 40.9 to 41.2%. Despite the increase, Westpac has the lowest cost ratio among the big banks.
CBA’s operating expenses rose 6%, while its cost-to-income ratio fell from 43.8% to 42.9%.
ANZ’s operating expenses rose six%, while its cost-to-income ratio fell two bps to 44.3%.
NAB’s expenses rose 11.6%, while its cost-to-income ratio rose from 41.6% to 45.4%.
All commentators agreed that the banks would continue to face pressure on their margins, due to the combination of modest lending growth, intense competition for deposits and loans, and low interest rates. PwC said it was likely that margins would fall further.
Commonwealth Bank was the only one of the four to report growth in its margin – up 4 basis points (bps) from the previous corresponding period to 2.14%.
Westpac’s net interest margin fell 8 bps to 2.11% over the same period, NAB’s margin fell 9 bps, and ANZ’s margin fell 10 bps.
CBA produced the best return on equity, with its ROE up 80 bps over the previous corresponding period to 18.7% (on cash profit).
Westpac’s ROE rose 43 bps to 16.05%, ANZ’s ROE was unchanged at 15.5%, and NAB’s was unchanged at 14.6%.
These reports were first published in Banking Day, between May 2, 2014 and May 9, 2014. www.bankingday.com. The comments published are not financial product recommendations and may not represent the views of Eureka Report. To the extent that it contains general advice it has been prepared without taking into account your objectives, financial situation or needs. Before acting on it you should consider its appropriateness, having regard to your objectives, financial situation and needs.


