Can the solar 'bachelor' go steady?
For the last few years solar has been a bit like a freewheeling bachelor, enjoying some absolutely fantastic big nights out. Yet these have been countered by great uncertainty and sudden crises where it looked like it might all come to a crashing halt.
The question facing the sector is: can it find a safe and happy medium more akin to a steady relationship? Sure it might have to accept that the massive binges where the phone wouldn’t stop ringing become a thing of the past, but at least life becomes more predictable and sales more reliable.
The Renewable Energy Certificate Agents Association has released a new report today which provides a great statistical snapshot of the industry over the past few years, providing our charts of the week.
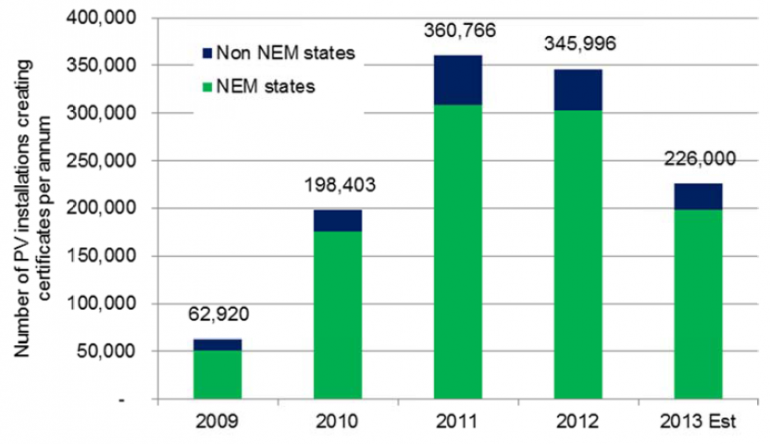
The report seems to suggests that 2011 and 2012 were the years when solar was in its bachelor prime. Having beefed-up its muscles in 2009 and 2010, by 2011 the combination of feed-in tariffs, a high Australian dollar and rapidly rising electricity prices acted like an irresistible aphrodisiac to householders.
But with the wind-up of feed-in tariffs in 2013, things have settled down. The industry employed more than 17,000 people in 2012 across around 4200 businesses. But employment is estimated to have declined in 2013 by 3400 people as the level of installations drop away. Yet we’re still looking at an industry involving $3.3 billion in revenue, so it’s not about to return to its hobbyist, cottage industry past.
Figure1: Number of Australian solar PV installations per annum, 2009-2013

Source: Green Energy Markets (2013)
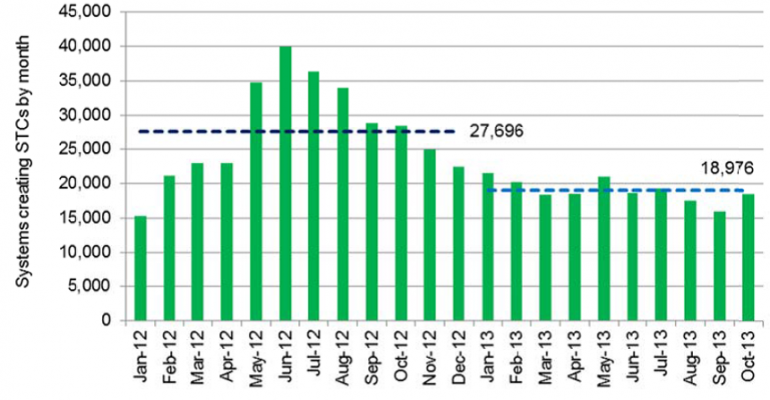
Delving in a little bit deeper into the monthly installation numbers, we can see that while this year has involved a painful contraction, it has been far less volatile than 2012. In breaking the gigawatt of sales in 2012 much of it involved a huge binge around the middle of the year supported by the heady cocktail of the Renewable Energy Certificate (or ‘STC’) multiplier step-down (the level of the rebate dropped after June 30, 2012) and the wind-up of feed-in tariffs in Queensland and Victoria.
Figure 2: Number of systems creating STCs by month, 2012 to 2013

Source: Green Energy Markets (2013)
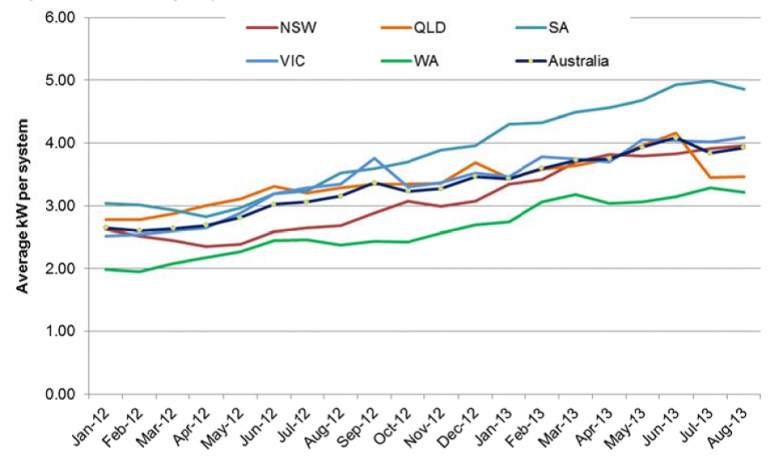
But what has been quite peculiar is that the average size of solar PV systems being installed has continued to grow in 2013, as shown in the chart below. This flies in the face of economic logic because the price paid for generation exported to the grid has been slashed from levels like 20 to 44 cents, down to 8 cents. Bigger systems means more generation surplus to household demand and greater exports to the grid earning a measly 8 cents.
Figure 3: Average solar PV system size by month and state – Jan 2012 to August 2013
Source: Green Energy Markets (2013)
You’d expect that once you go beyond 2kW a very large proportion of the generation would be exported. Back midway through 2012, when the average system size was about 2.5 kilowatts, Climate Spectator predicted the growth of system sizes would halt and possibly decline with the nationwide cessation of premium or even one-for-one retail feed-in tariffs. Yet you can see that as at August this year, the average size system has now grown to 4 kilowatts. Although, one can see a dramatic drop in Queensland system sizes in July 2013 with the cessation of eligibility for their 44 cent feed-in tariff.
In addition Ric Brazzale, the author of the report, notes that part of the reason for the increasing average system size could be the influence of more systems being installed on commercial business premises. Such systems can be tens of kilowatts, and by looking only at averages across the entire market, it could disguise a trend in the residential sector of steady, or even declining system size. Brazzale’s team haven’t done a breakdown of the numbers as yet to see whether averages may have been skewed by an increase in the proportion of very large commercial systems.
So what does the future hold? The Clean Energy Regulator’s preliminary target is for about 750MW in 2014, this equates to a 50MW drop from 2013. After experiencing a 224MW contraction this year, the industry will probably be thankful if it can achieve such steadiness in sales in 2014.
But there’s also a cloud overhanging the industry with the Renewable Energy Target coming up for review again less than 12 months after the government concluded its last review. In the industry’s favour, however, is that the cost of the support scheme is on the way down, according to the RAA’s report. This year it represented an incremental cost on householder bills of just 2.6 per cent. If sales hold at 750MW in 2014, it will drop to just 1.4 per cent of a household electricity bill. At the same time it has been helping restrain other components of householder’s bills by putting competitive pressure on existing conventional power generators.
Could an industry used to double digit growth be happy with going steady next year? It seems after a tough 2013 it would be incredibly relieved.


