Australian property in context


For the average Australian, the local property market has been riding a bit of a rollercoaster. For the wealthiest investors of the world, Australia is hot property.
That’s according to Knight Frank, which produces the Prime Global Cities Index every quarter.
Five cities downunder ranked in the top 32 for luxury residential price growth, making Australia the only country with such a showing. The Gold Coast entered the index for the first time, a city where Knight Frank holds a post, on the back of robust demand from downsizers.
On this year’s index, Sydney ranked 18th (2.5 per cent annual growth), Brisbane ranked 20th (2.2 per cent), Melbourne ranked 21st (2.1 per cent), the Gold Coast ranked 27th (1.1 per cent) and Perth ranked 32nd (0.6 per cent).
Even more surprising, amid the downturn, Australia outperformed the global average. Sydney, Melbourne and Brisbane all recorded growth higher than the average annual prime price growth of 1.4 per cent across 46 global cities.
.JPG) Sydney and Melbourne, in fact, moved up the rankings. Sydney reclaimed the top spot for Australia, while Melbourne moved up one spot from the previous quarter.
Sydney and Melbourne, in fact, moved up the rankings. Sydney reclaimed the top spot for Australia, while Melbourne moved up one spot from the previous quarter.
The Prime Global Cities Index increased by 1.4 per cent in the year to June 2019, up marginally from 1.3 per cent in March 2019, but still significantly lower than its 4-year average of 3.8 per cent.
Some 35 of the 46 cities tracked by the index (76 per cent) registered price growth in the year to June 2019.
Context is important
The Australian property market hasn’t exactly been a star performer. The top end just pulled a lot of weight, having more muscle to do so.
In 2018, a year when the Australian market weakened, both in terms of shares and property, the wealthiest Australians didn't do too poorly. You only have to take a glance at the Rich List to see how they were enjoying their spoils. Of the ultra-wealthy clients that Knight Frank surveyed, 93 per cent reported their wealth to have increased in 2018, despite admitting it wasn’t easy.
On average, these respondents allocate one-third of their wealth to property and own three residential homes.
This Knight Frank reporting period hasn't captured money market movements since March 30, which we have done for you on the right. However, even anticipating further interest rate cuts, Knight Frank doesn’t expect this to do much for prime Australian property. The property consultancy thinks prices will moderate further in the second half of 2019 before strengthening in 2020.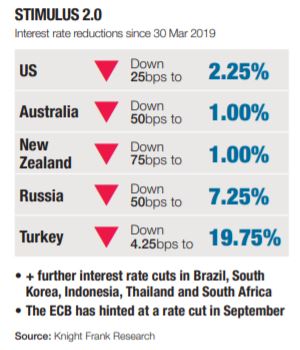
The figures won’t mean everything to everyone. In any case, the property price rises underlying the Prime Global Ciites report are small, especially compared to previous years. Check the chart on the right if you need any more evidence that context is key.
As with anytime we measure investment performance, so too is the time horizon.
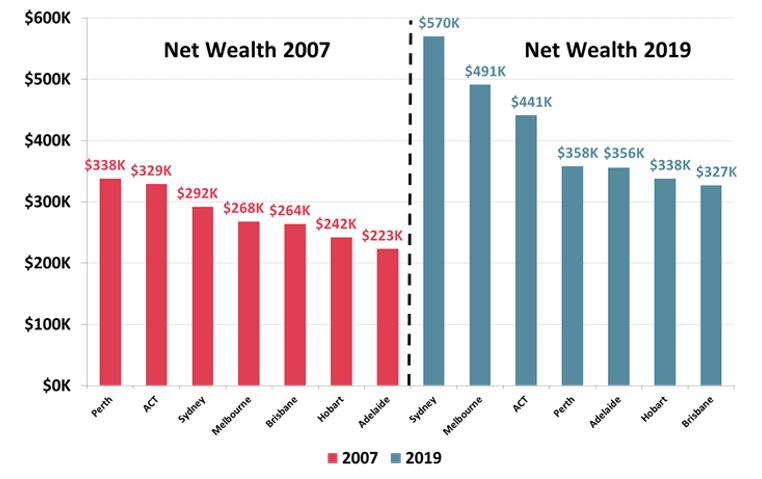
To that point, Roy Morgan Research published a different wealth report earlier this month. Roy Morgan Research highlighted the fact that Perth residents had the highest net wealth on average out of all of Australia. If that’s news to you, don’t worry, as it’s no longer true, with Sydneysiders recently taking the lead.
The people of Perth had the lead between December 2007 and March 2019. During that time, the average net worth (personal assets minus debt) per capita for Perth was $338,000. That’s an average, not a median figure.
Source: Roy Morgan Research
This is a read that captures the end of the last widespread mining boom, prior to the current resurgence of certain commodities. Above all though, this is a property story.
“These wide variations in growth rates have a lot to do with real estate prices where Sydney and Melbourne have generally shown the greatest increases,” says Michele Levin, CEO of Roy Morgan.
“Evidence for the impact of this is that there is a much higher proportion of personal wealth in NSW held in owner occupied homes (52.9 per cent), compared to some other lower value States such as SA where it is only 42.9 per cent and 46.1 per cent in WA.
“The wealth of Perth and Country WA in 2007 was due to increased housing prices and economic activity associated with the mining boom.”
Recent house price falls, and you can see them here, detract from the long-term narrative. Sydneysiders and Melburnians still have more money in their pockets, or at least in their walls. In the grand scheme of the world, based on the Knight Frank data, Australia still appears attractive across the board.


