Your returns in 2024


Summary: It's foolish to forecast returns over a one-year period, but it's easier to work out expectations for the next 10 years. Taking into account recent volatility and the current price/earnings ratio of the share market, it's possible to assume that the All Ordinaries will grow to 9,000 points by 2024. Returns look much better than over recent times for share investors, but punishing for conservative investors. |
Key take out: Conservative investors are likely to earn a lesser return over the next 10 years than the long-term average. They may wish to consider slightly reducing spending or slightly increasing their allocation to equities. |
Key beneficiaries: General investors, conservative investors. Category: Economics and investment strategy. |
Predictions for share market returns one year out are notoriously inaccurate. While they are entertaining, they aren't terribly relevant as anyone with a time horizon of one year has no business investing in shares. Most however invest with a ten or more time year horizon where it is more possible to forecast returns - which I do here.
To manage expectations about how accurately we can do this, let's first look at the last 140 and the most recent 10 years to see how returns have varied. This will show that even with this long lens, forecasts are no certain thing and the last 10 years have been unusual. That said, read on to find my forecast for the All Ordinaries in 2024.
Looking a long way back
Figures 1 and 2 show the annual returns for 10-year periods ending as early as 1884 and late as 2014, for Australian shares and 10-year duration Government bonds. The solid lines show “nominal”, before-inflation returns and the dashed lines real, after-inflation returns. Share returns include reinvesting dividends. For the statistically inclined, alongside the vertical axis I have also shown a histogram distribution of annualised nominal returns.

Figure 1: Annual returns from investing in Australian shares for 10-year periods ending 1884 to 2014 before (solid line) and after (dotted line) inflation. Shown on the left axis is the distribution in before-inflation, nominal returns.

Figure 2: Annual returns from investing in Australian, 10-year maturity, Government bonds for 10-year periods ending 1884 to 2014 before (solid line) and after (dotted line) inflation. Shown on the left axis is the distribution in before-inflation annual returns.
These charts tell us a number of things about past share market returns:
- The average share market return is 11% before and 8% after inflation
- The volatility or standard deviation is about 4% or one-quarter that of one year returns
- This means two out of three times nominal returns are expected to be between 6% and 16% and 95% of the time between a still very wide 2% and 21%
- These ranges tighten up a little to 9% to 16% and 5% to 19% if you count from 1900 and exclude the returns from Australia's Great 1890s Depression
They also tell us about bond returns:
- The average bond market return was 5.6% before and 2.9% after inflation
- The standard deviation of bond returns before inflation is about 3% but a higher 4% after inflation
- The fact that after-inflation returns from bonds have been more variable and failed to beat inflation about a fifth of the time is why Wharton Professor Jeremy Segal never published Bonds for the Long Run as a sequel to his best-selling book Stocks for the Long Run
While this means even annual returns over 10 years vary a lot, I'll point out later that future share market returns are slightly more certain when you take into consideration the market's starting price or P/E ratio. Bond returns, before inflation, are much more certain as they are based on current yields – future capital gains or losses relevant only if you don't hold them over the maturity period.
The last 10 years
Recently I wrote about what's unusual today and how focusing on that might guide your investing (see: A dozen ideas for this odd market). Another unusual point about the last 10 years is that it didn't matter if you were labelled a conservative or an aggressive investor or in-between – you earned about 7% annually regardless. You can see this in Figure 3 which depicts the annual returns for Vanguard's range of multi-asset portfolios (plus an all bond and all equity portfolio) for the 10 years ending 30 September 2014 (red line). Also shown are the returns one would expect if we had invested in “average times” (blue line)

Figure 3: Total annual returns for the 10-year period ending 30 September 2014 from Vanguard's conservative (30% equity), balanced (50%), growth (70%) and aggressive (90%) portfolios plus constructed returns for an all equity and all bond global fund – shown in red. Shown in blue, are estimated returns based on long term averages.
Back in 1994, growth (70% shares), aggressive (90%) and all equity (100%) investors would have reasonably expected to be more rewarded than balanced and conservative investors. This didn't happen for two reasons. First, share market returns were hurt by the GFC. Second, bond market returns were helped by it.
The next 10 years – bond and deposit returns
The current yield on a 10-year maturity (2024) Australian Government bond is a measly 3% (see for yourself in the details about these now ASX listed bonds: check the yield column). If your bond portfolio is made up of this ultra-conservative AAA-rated bond, then I can predict with 100% accuracy that your return over the next 10 years will be … 3%. For a bond investor this is a whopping 2.6% less than the 140 year average return of 5.6%.
Coincidentally this 3% yield is about also the current yield of the more common Australian bond benchmark that most local bond funds follow – though that is made up also of higher returning, less credit-worthy State Government and corporate bonds and held for a compensating shorter average maturity of about five years. This starting yield means that a typical Australian bond fund without any active return will also earn a very accurate 3.2% annual return for the next five years. If we assume, and hope, that in five years' time the bond market will revert and stay at its usual average yield of about 5.6% then the 10-year average annual return from a typical Australian bond fund would be 4.4% (3.2% 5.6% divided by 2). This is a 2.4% lower return than the tailwind-assisted 6.8% earned over the last 10 years for a typical bond fund.
Unless there is a dramatic rise in interest rates half way through the next 10 years then it is very likely that bond returns will be lower than they have been in the past and especially recent past. This is the same if you are a direct bond investor, however, your absolute return will be higher if you take on more credit risk and provided you're not punished for doing so. For comparison purposes a five-year fixed rate loan to A-rated Telstra is currently yielding only 4% or 0.8% above the bond benchmark (and less than a five-year AAA Government guaranteed TD from Rabobank paying 4.2%). Strange times.
If you are a depositor not a bond investor, then your average return over the next year will be the average of your deposit interest rates, starting just slightly above this same 3.2%. You need interest rates to shoot up quickly and stay up to do better than before … and if you do, sadly it might simply be (part) compensation for higher inflation.
If you are an inflation-linked bond investor your real returns are certain. These bonds are roughly earning about 1-2% plus inflation – or about 4% depending on your estimate of inflation.
The next 10 years – share market returns
Share market returns are much harder to predict. However earlier to build the case for buying shares I showed like for the US market, the price-to-earnings ratio (P/E) at which you invest influences your long term returns (see A pointer to higher returns, 29 August 2012). In short, if you invest when the market P/E is below average (like then) it is likely that your returns over the next 10 years will be above average and vice versa – like now.
The correlation is about 1:1 which means if you believe that the share market is trading about 1 P/E unit above its long term average, then you could expect to earn a 10% not 11% return over the next 10 years. McKinsey recently found that the US market was trading above its longer term average by about two units of earnings, however one of those units equalled over $1 trillion of surplus cash on the balance sheet of many American firms that can be fairly accounted.
While interest rates are unusually low, it is entirely expected that the share market should trade on a higher price (or above average P/E). However it is also expected that if in 10 years' time interest rates revert to normal, so should P/E, which will depress returns. In short the rubber band of equity prices will relax back to normal when normal conditions resume but that will hurt your returns.
In Figure 4 (and the below table) I have overlaid on the earlier shown chart, returns for the next 10 years for two scenarios:
- Bond and deposit returns are 1.2% lower than average but the share market performs at its long term average
- Bonds/deposits underperform and so do shares by 1% assuming an about 10% over-valuation is unwound
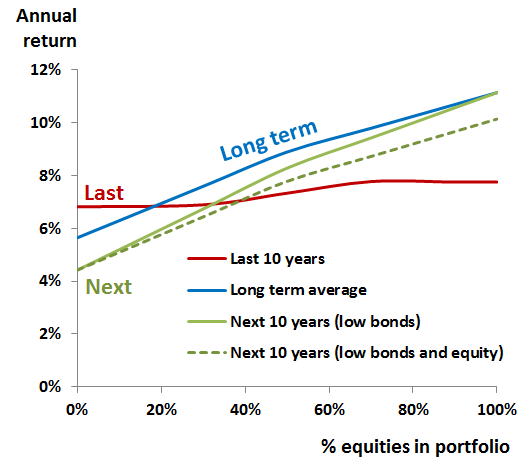

Figure 4 and Table 1: Portfolio annual returns for last 10 years, those expected based on long-term averages and directionally-forecast for next 10 years if bonds only underperform (owing to low starting yield) or shares also underperform (owing to P/E reversion or shock).
Under these assumptions over the next 10 years a conservative investor's portfolio would grow by 25% less and a balanced investor's portfolio by 10% less (or 15% less if equities underperform also). If equities return their long term average than todays All Ordinaries price index of 5,300 would grow to 9,500 (assuming 6% annual price growth). But if shares underperform by 1% annually, then it would grow to a lesser 8,600. For the record I'm happy to go with 9,000 as even an implied /- 1,000 is a guesstimate.
Conservative investors beware
As conservative investors are more certain to earn a lesser return going forward, they especially need to consider whether they can live with this, or if not, what steps to take to manage this.
Conservative investors who have ample capital available to fund living expenses don't need to do anything. On the other hand, those who plan on spending all that they can (see my earlier article How much is enough?) may wish to reduce annual spending by about 0.5% of their portfolio amount (roughly 10%) if they don't plan on changing their asset allocation. For those who want to earn the long-term return for their current allocation, consider allocating 10% more to equities – provided they can handle the extra portfolio volatility. Because the “spread” or reward for taking on more credit and duration risk is near record lows, I wouldn't recommend becoming an aggressive bond investor to fill this return gap.
It is not my intention to scare investors, especially GFC-bruised conservative ones. But I am pretty certain future returns for them will be less than before, and I'm not alone. So does industry-fund asset consultant Frontier. Of course the good news is I'm also quite certain equity returns over the next 10 years will be better than they have been over the last 10 years.
Dr Douglas Turek is principal advisor with family wealth advisory firm Professional Wealth (www.professionalwealth.com.au)


