Why wind wreckers are often left snatching at air
Each year, Ryan Wiser and Mark Bolinger from the Lawrence Berkeley National Laboratory put out a superb report documenting developments in the US wind power market. Even though the report concentrates on the US market it provides one of the most insightful reference documents into how wind power technology and its economics are evolving over time on a global basis. This is built from a database which tracks a wide array of key metrics on a very large number of wind power projects across the country.
One of the things I find so irksome about many of those who criticise renewable energy is that they use appallingly out-of date costings, often from reports using market data from as long as four or five years ago. We saw this kind of typical error in the case of the Deloitte Access Economics' work undertaken for the Business Council of Australia and the Australian Chamber of Commerce and Industry on the Renewable Energy Target.
Our charts of the week are taken from Wiser and Bolinger’s latest report, which finds that wind farms in 2013 are signing long-term power purchase agreements at rock-bottom lows.
The charts also help to illustrate how wind economics are regularly changing and evolving; yet the technology’s performance is constantly improving.
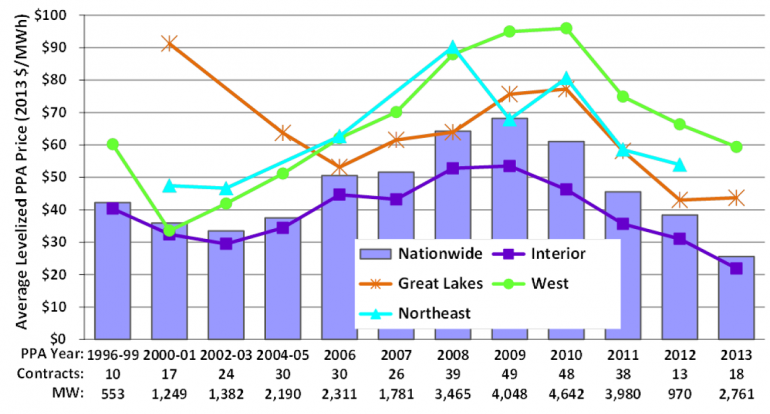
The chart below details PPA prices inclusive of a bundle of wholesale electricity and renewable energy certificates (which count towards state government renewable energy targets common across the US) struck by wind farm developers across four regions of the United States (the quality of the wind resource varies by region). These show that, after an inflationary period from 2002 to 2009, contract prices have dramatically declined and now sit at record lows.
Figure 1: Evolution over time of power contract prices per megawatt-hour for wind projects, by year executed (inclusive of renewable energy certificates)
Source: Wiser and Bolinger (2014) 2013 Wind Technologies Market Report
Now this doesn’t mean the all-inclusive cost of power from wind farms in the United States is now $US25 per megawatt-hour, because one also needs to add on the value of federal government tax credits (worth about $US20/MWh) and other government incentives which act to subsidise wind farm output. Nonetheless, this decline in costs reflects underlying and considerable improvements in wind turbine technology which have allowed costs to decline in spite of a move towards lower wind speed sites.
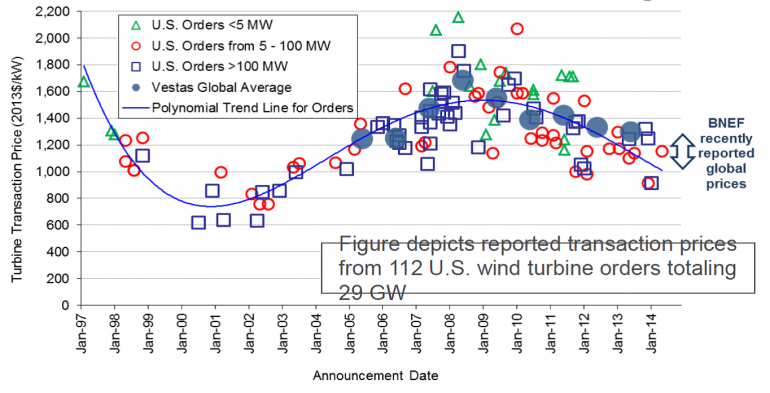
Firstly, prices of turbines have experienced considerable declines from the overheated market of 2007-2009 when demand substantially outstripped supply. Wind turbines (the generator, blades and nacelle) are now being sold into the US market at around $1000-$1200 per kilowatt.
Figure 2: Wind turbine transaction price over time
Source: Wiser and Bolinger (2014) 2013 Wind Technologies Market Report
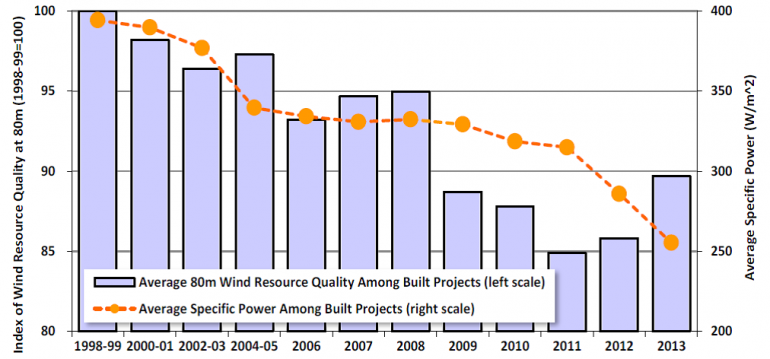
Now while this is still noticeably higher than prices prevailing around 2002, you need to recognise the current-generation turbines achieve vastly better power output from a given wind speed. The chart below illustrates an index of the average wind speed quality of projects by build date in the Berkeley Lab database. Projects being built in 2011 and 2012 were making use of resources with wind speeds 85 per cent of the levels employed in projects built in 1998-99.
Figure 3: Quality of wind resource exploited, by wind farm construction year
Source: Wiser and Bolinger (2014) 2013 Wind Technologies Market Report
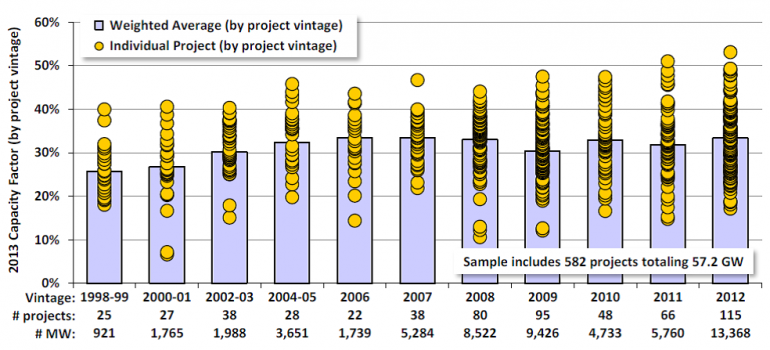
Yet in spite of declining wind speeds projects built in recent times achieve levels of power generation per unit of capacity, or ‘capacity factors’, similar to those of earlier projects that had access to higher wind speeds. So turbines today deliver a far better bang for buck than those of a decade ago.
Figure 4: Capacity factors of US wind farms, by construction date
Source: Wiser and Bolinger (2014) 2013 Wind Technologies Market Report
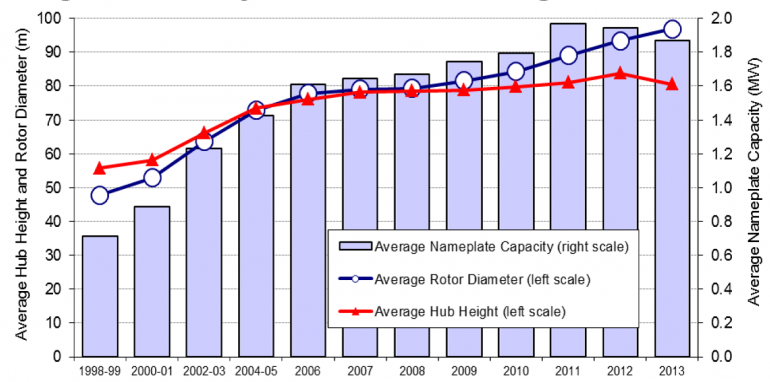
What has driven this improvement is partly going higher – placing the turbine on taller towers – as wind speeds tend to improve the further above ground you go. Although, you can see in the chart below that heights have levelled out. Also, going for bigger generating capacity per turbine has realised economies of scale – but these have recently declined. Where the improvements have been most marked since 2008 have been the increases in blade length, or rotor diameter.
Figure 5: Average hub-height, generating capacity and rotor length of wind turbines, by installation year
Source: Wiser and Bolinger (2014) 2013 Wind Technologies Market Report
Wind turbine manufacturers have put intensive effort into how to adjust the shape, flexibility and construction of blades to make them longer while keeping weight down and maintaining strength and reliability. Longer blades that remain relatively light provide a greater surface area exposed to the wind, enabling them to turn a generator with lower wind speeds.
In the end – as we find in so many other areas of natural resource exploitation – technological efficiency advances faster than the rate at which the resource is consumed. So even though many of the best wind speed sites are already taken, the total economically viable resource is actually expanding.
Of course, the great thing about wind, versus non-renewable resources, is that the best wind speed sites don’t deteriorate over time because they host a wind farm. So when the first lot of wind turbines wear out we’ll be able to replace them with the more advanced turbines – and considerably expand the amount of power we can extract from the high quality wind sites.
These advancements in turbine technology are a key reason for why the Victorian Government’s recent decision to allow developers to adjust wind turbine layout without obtaining a new planning approval was so important. For many Victorian wind farm development sites, their planning approvals were based on turbine designs that are now as much as four years old. By being allowed to employ turbines with larger rotors, which will often require a higher hub height than older designs, it should substantially improve the economics of these Victorian wind farms.
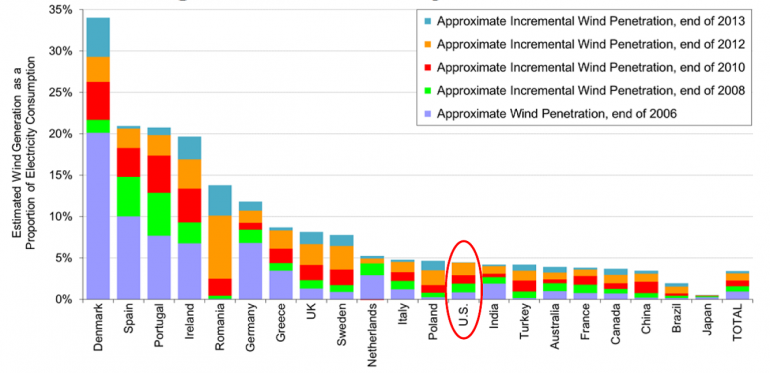
What’s also interesting from this recent report is that wind continues to expand its level of power generation market share in a range of countries to levels the naysayers said weren’t possible. Denmark is now past 30 per cent wind penetration and approaching 35 per cent. And there are now another three further countries in, or on the verge of, the beyond 20 per cent club. Twenty per cent penetration used to have an almost mystical quality to it, seen as the absolute limit to how much wind a grid could absorb, but that’s now been consigned to an old wives' tale.
Figure 6: Wind generation share of electricity consumption by country
Source: Wiser and Bolinger (2014) 2013 Wind Technologies Market Report
So the lesson from all this is that wind turbine technology, and the associated market, are never standing still. Anyone using data from more than a year or so ago is likely to be getting it wrong.


