Why the US can't escape Minsky
My call a few weeks ago that the global financial crisis is over was very much an Anglo-centric one, and a US-centric one in particular (Closing the door on the GFC, March 10).
Europe’s continuing own goal from the euro and austerity, and credit excesses in emerging economies, could still derail a global recovery. But the epicentre of the crisis was the US, and the indications are solid there that this particular 'Minsky moment' is behind it.
It might be felt that Minsky is irrelevant, now that the economy has begun its recovery from this crisis. But in fact this period -- in the immediate aftermath to a crisis, when the economy is growing once more, and debt levels are only just starting to rise -- is precisely the point from which Minsky developed his explanation of economic cycles.
In his own words: “The natural starting place for analysing the relation between debt and income is to take an economy with a cyclical past that is now doing well.
"The inherited debt reflects the history of the economy, which includes a period in the not too distant past in which the economy did not do well.
"Acceptable liability structures are based upon some margin of safety so that expected cash flows, even in periods when the economy is not doing well, will cover contractual debt payments.
"As the period over which the economy does well lengthens, two things become evident in board rooms. Existing debts are easily validated and units that were heavily in debt prospered; it paid to lever.”
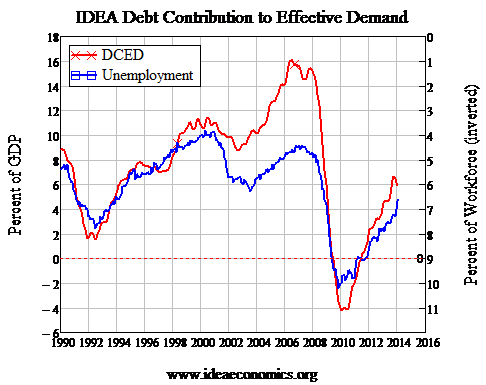
So the US hasn’t escaped Minsky -- it can’t. Minsky’s message is for the whole financial cycle, not just the moment when it turns nasty. At the moment, we’re in the nice phase of Minsky’s cycle, when it pays to lever. Leverage is clearly on the rise, as Figure 1 indicates.
The acronym “DCED” stands for debt contribution to effective demand and measures the annual change in private debt divided by GDP.
As I’ve explained before, this isn’t the entire measure of debt’s contribution to demand, but it does indicate whether it’s positive or negative, and its rough scale. IDEA is the “Institute for Dynamic Economic Analysis”, which will be maintaining these indicators for the US and other countries in future.
The ‘Great Deleveraging’ saw the change in debt plummet from a peak of plus 16 per cent of GDP in mid-2006 to minus 4 per cent in 2010. Now the US is back in strongly positive territory, with the rate of growth of debt being about twice that of real GDP. So the US is at the very beginning of a Minsky cycle.
Figure 1: Change in debt drives economic growth (correlation with unemployment is -0.9)

That’s especially clear when you go beyond the aggregate credit data to look at what households, businesses and Wall Street speculators are doing. All credit indicators, bar one, are positive, and the one that is still barely negative (mortgage debt, see Table 1) is bound to cross over into positive territory when the Federal Reserve releases its next update.
Table 1: The private debt numbers for the USA
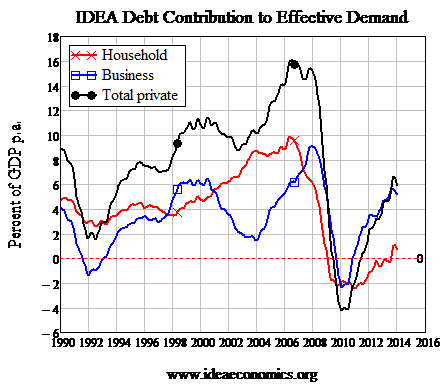
That said, the US is starting this cycle rather more virtuously than the last. The last Minsky cycle began in the aftermath to the 1990s recession, when household debt went on an unprecedented growth spurt -- from 3 per cent of GDP per annum back in 1992 to a peak of 10 per cent of GDP in mid-2006.
That slow but dramatic rise is the main reason the downturn after the dot-com bubble burst in 2001 was so mild: the sharp fall in business borrowing (from 6 to 2 per cent of GDP) was attenuated by the 2 per cent increase in household borrowing over the same period (see Figure 2).
The result was a smooth baton change from the dot-com bubble to the subprime bubble. Then the economy fell in a heap when first the household sector and then business began to delever sharply, with households commencing in early 2006 and business following suit in 2008.
This time, business debt is in the lead. This is a positive thing, since businesses are the ones who truly invest, not households (let alone Wall Street speculators).
There’s plenty to invest in right now -- biotech, nanotech, 3D printing, electric vehicles, the recovery itself -- and at least some of that borrowed money should be fuelling genuine investment in industry.
Figure 2

At some point this virtuous phase will give way to vice, when what Minsky called “euphoric expectations” take over as the memory of the GFC fades, and the resulting boom will prepare the grounds for the next bust.
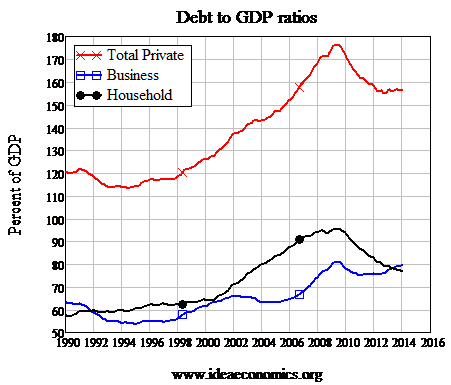
That is likely to happen sooner rather than later, because yet another of Minsky’s economic intuitions is strongly confirmed by the data: each Minsky cycle tends to start from a higher level of debt than the preceding one, making the economy more fragile. This new Minsky cycle is commencing from a debt to GDP level more than one third higher than the previous one that began in 1994 and crashed in 2007 (see Figure 3). It certainly won’t be 17 years before the next Minsky moment.
Figure 3

Steve Keen is author of Debunking Economics and the blog Debtwatch, developer of the Minsky software program and chief economist for the Institute of Dynamic Economic Analysis.


