Why solar systems are growing
A few weeks ago Climate Spectator noted how average solar system sizes installed in Australia have been steadily growing and now stand at 4 kilowatts. At the time we were a touch puzzled by what might be behind this trend and whether it might signal greater prevalence of larger installations on commercial business rooftops. New data released by Sunwiz’s Warwick Johnston, derived from his Insights solar market data analysis tool, has provided some greater clarity. Below are some of Johnston’s observations.
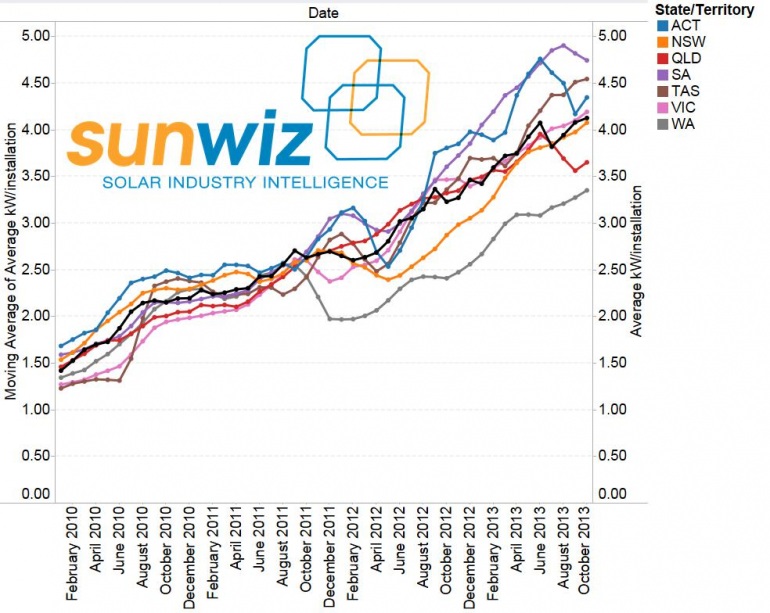
To recap the chart below shows average system size by month for each state (colour; smoothed) and nationally (black). When feed-in tariffs were removed in WA and NSW, the average system size fell markedly. However, since that point the average in these states has grown in parallel with the national average. NSW now sits in line with the national average (though this is because NSW is the most successful market for commercial PV, which it was forced to focus upon earlier than other states due to the lack of feed-in tariff for residential systems), while WA is far behind. Since Queensland's feed-in tariff installations were completed, average system size has declined markedly as there is no longer a 44c/kWh incentive to export power. Meanwhile average system sizes are currently high in Tasmania and South Australia, both of whom presently enjoy feed-in tariffs, though SA is also starting to fall back.
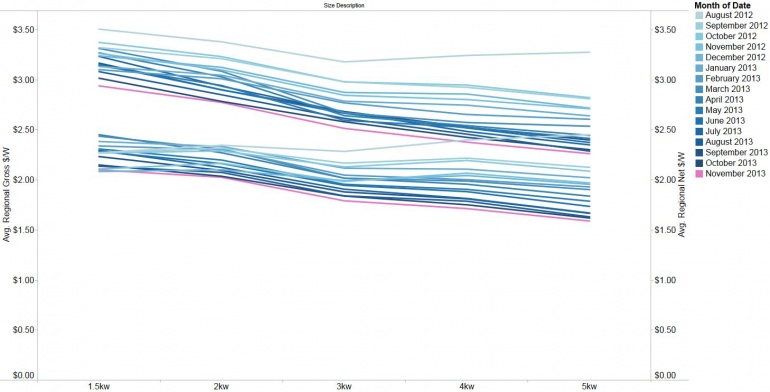
A major reason that customers have been buying larger systems is their steadily-improving economy. The graph below shows the evolution of the net price (after the STC rebate discount) and calculated gross price (before STC discount) in terms of dollars per watt for a range of system sizes of PV retailers that list prices through Solar Choice. More recent months are shown in darker blue, with the most recent month shown in pink. It can be seen that the gross price has near-continually declined over time, and that there is an appreciable economy of scale for larger systems. Net system prices have varied more as the solar multiplier was eliminated and as the STC price recovered. The average net price of a 5kW system has thus fallen by one-third from $12,500 in mid 2012 to $8000 today.
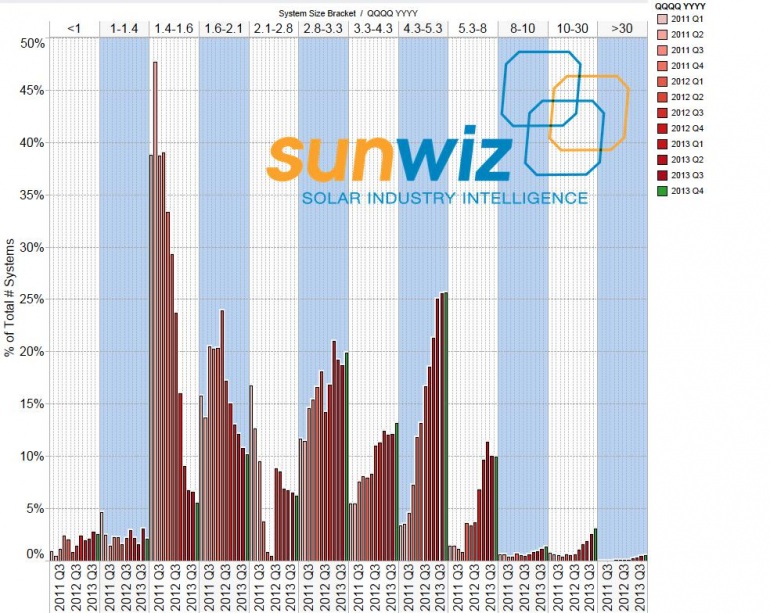
Over this time the nature of solar installations has also shifted considerably. The national distribution of system sizes by quarter shown below reveals the earlier popularity of 1.5kW systems is now more focussed upon 5kW systems. At one point, half of all systems installed were 1.5kW in size. Most recently 25% have been 5kW in size. However, the shift towards larger residential systems seems to have plateaued. The proportion of 3kW, 4kW, and 5kW systems has been steady for almost a year. What we're seeing now is the emergence of a market for commercial solar. 3% of systems installed recently are in the 10-30kW range, but 10% of volume (by kW) falls into this range, plus another 7% in the 30 kW range. Considering that in 2012 only 5% of capacity exceeded 10kW in size (and a lot of that was driven by solar schools and feed-in tariffs), we're finally seeing a remarkable shift towards commercial PV in Australia.
Where has it ended up?
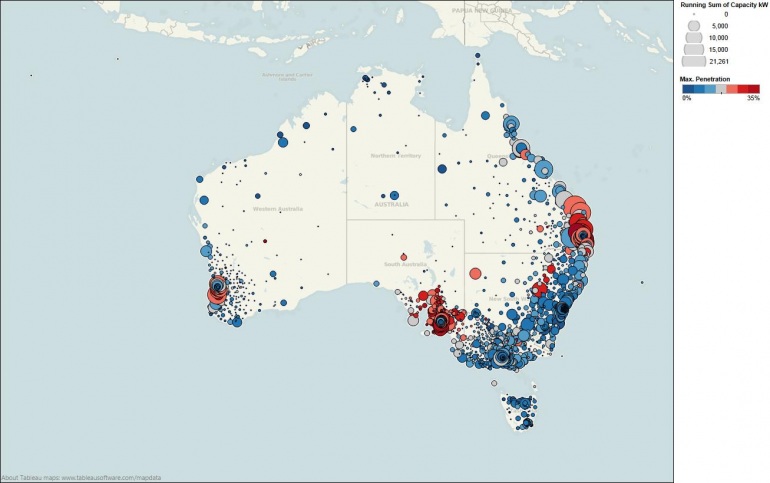
The map below shows the total installed capacity by postcode (size of dot) and the proportion of total dwellings that have solar power. The greatest volume of solar power lies along the Queensland coast. There is clearly highest penetration in South Australia and South-east Queensland, though the area surrounding Perth also has a high solar density. Installations are naturally concentrated in capital cities, though there is greater geographic spread of solar in Victoria and New South Wales.
Warwick Johnston is managing director of Sunwiz Consulting.
This information above regularly appears in Sunwiz’s monthly Insights subscription publication. This article was originally produced by Sunwiz. Republished with permission.

