Time to look hard at PV soft costs
The ironic thing about comparing data to the real world is that if we are tuned in well, they tend to prove what we intuitively know. But it’s nice to have proof.
Take last week for example.
I was in South Australia participating in a seminar series on ACPV (AC modules) and how micro inverter equipped PV modules are increasing dramatically in Australia. As I prepared for the seminar to start, I took in the view across Westlakes and quickly realised I was staring at a multitude of PV systems. I counted the number of houses I could see, and then the number of houses with PV fitted. Blow me down if this random sample wasn’t exactly representative of the state’s average uptake of PV!
Smack on 30 per cent of the homes I was staring at had a system fitted. Armed with the latest feedback from delegates, I then counted the number of homes with shading or multi faceted roofs (which would benefit from the use of ACPV) and blow me down; reality was right on the money. More than 30 per cent of the homes I could see with PV, had non optimal roofs.
I recently wrote about the rising issue of compliance costs in solar installations and added some recent statistics based on my intuition and a few discussions, but it prompted me to conduct a survey to collect some new, more up to date data. Thanks to all of the installers who participated we were able to collect a quick sample of data points and take a look at this issue in more detail.
The US conducts such analysis on a regular basis through publically captured data but Australia doesn’t. When I recently attended Intersolar USA, I gorged on some comparative statistics looking at the relative cost breakdowns in the US and Germany an issue that is a huge area of focus in the US due to significant differences in average system costs (the US is almost twice as expensive). So getting some data we could compare ourselves to and understanding where we have relative advantages and disadvantages was also valuable.
To try and get some consistency and an apples to apples comparison, we asked all respondents using the following assumptions:
– Average costs in Australian dollars per watt of each item,
– Based on a system size of 3kW
– Before STC discounts and excluding GST
– Before adding Gross Profit
– Applicable at the time of the survey.
We then asked them to break down system costs into the following categories:
– average PV cost in A$/W;
– average inverter cost in A$/W?
– average racking system cost in A$/W?
– average installation cost in A$/W (PV, racking, inverter and wiring)?
– average on site compliance cost in A$/W? (on site compliance paperwork, safety paper work, serial number recording, inspection, metering and commissioning);
– average in office compliance cost in A$/W? (system design, quoting, contracts, financial modelling, rebate applications);
– average customer acquisition cost in A$/W? (marketing, sales, lead creation, lead management etc);
– average other costs in A$/W? (eg cost of stock, other overheads etc);
– average gross profit in A$/W ? (over and above costs);
– average system price to the customer in A$W? (i.e. the build up of all your costs plus your gross profit).
The first, and arguably most interesting finding was that many Australian installers hadn’t actually analysed this very much. At all. I received a number of responses like 'I have no idea, but it's a really interesting point' and 'unknown'. Arguably, this is a function of how busy everyone has been simply doing the business but I suspect that it will become increasingly important as the market and cost build up changes.
Secondly, there was a lot of variation in the responses. Some of this was obviously down to errors and some was natural. We filtered out the extraordinary and abnormal results but were still left with a good range.

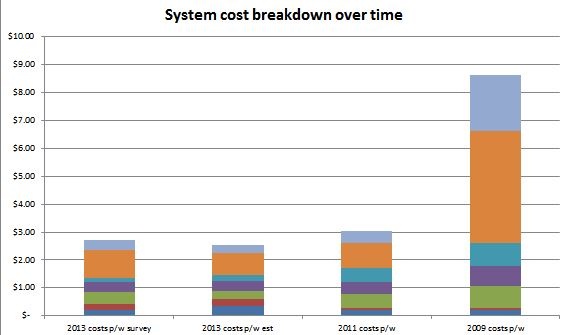
Thirdly, as we discussed in our last story on this topic, soft costs are highly significant. In summary hardware (PV, inverters and racking) are 54 per cent of costs, but have reduced dramatically. The other 'soft' costs are increasing significantly and almost of equal importance now.

How close were we in our estimates? We were 7 per cent lower in our original estimates than the average pre-STCs, pre-GST prices received in our survey of $2.72/W installed which is quite likely a function of the recent rise in PV price. This data is compared in the following graph.

Installation, wiring and compliance costs need to be your area of focus – but think efficiency, not cost stripping. No installer I have ever met thinks they are paid enough to do the job properly and the costs of complying are increasing as time passes. What this means is that we need to find ways to streamline our operations, automate processes, use technology to help us. A great starting point is understanding where your business is at compared to your peers.
Once, again my kind thanks to all those companies who participated in the survey. As a small thank you, those of you who participated and want the full excel sheet of results can email me for the data set so you can dig around in some more detail.
This article was originally published by Solar Business Services. Republished with permission.


