The rise and fall of polluter villains
With the release yesterday of the 2012-13 National Greenhouse and Energy Reporting data we now have five years worth of history on what’s been happening with various corporate groups’ greenhouse gas emissions.
AGL’s emissions growth stands out like a sore thumb thanks to its acquisition of Loy Yang A power station, and it would dwarf others if it manages to acquire Macquarie Generation (although today the ACCC announced that it intends to block the acquisition).
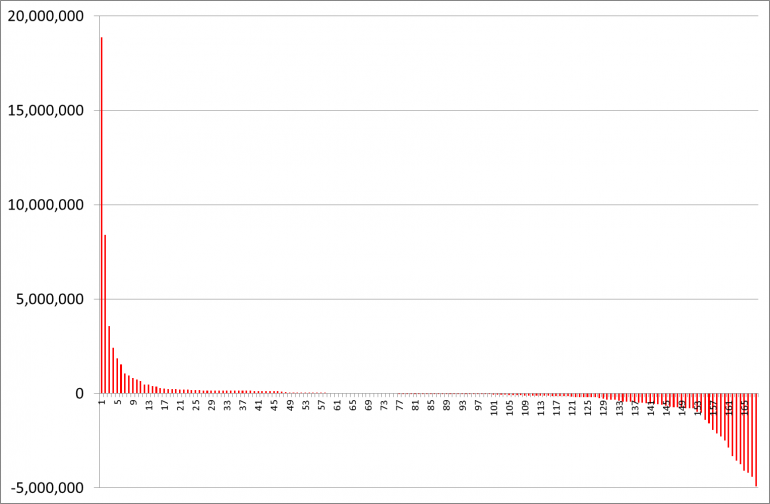
The chart below illustrates the change in emissions for the top 200 or so corporate emitters for 2012-13 versus their emissions in 2008-09.
As you can see, the vast majority of corporates have experienced little change in their emissions but there are some notable tails at each end where some companies have experienced a large increase, and also a number that have seen large decreases.
Change in Australian corporates' carbon emissions 2012-13 versus 2008-09
(tonnes of CO2 equivalent)

Source: National Greenhouse and Energy Reporting data, Climate Spectator analysis and data cleansing
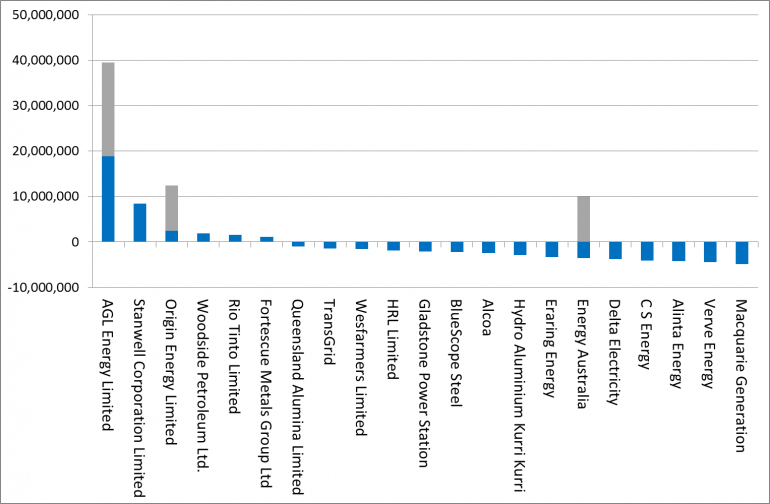
If we then focus in to the companies sitting in the tails (those with an emissions change greater than a million tonnes of CO2) it reveals just how large AGL’s emissions grew with the acquisition of Loy Yang A.
In addition, if AGL manage to bypass the ACCC’s opposition to acquire Macquarie Generation then the grey bar shows they’ll have grown by 40 million tonnes since 2008-09, equivalent to nearly 7% of Australia’s entire emissions.
I’ve also added grey bars to Origin Energy and EnergyAustralia to illustrate how their emissions footprint will change as a result of buying black coal generators off the NSW Government. Also, Stanwell’s emissions also grew substantially with the Queensland Government merging it with Tarong (which saw wholesale electricity prices subsequently skyrocket to the benefit of QLD Treasury).
Australian corporations experiencing large changes in emissions (>1Mt) from 2008-09 to 2012-13 (tonnes of CO2 equivalent)

(Note: Grey bars represent emissions attributable to acquisitions of NSW Government-owned generators.)
Source: National Greenhouse and Energy Reporting data, Climate Spectator analysis and data cleansing
Now, of course, this doesn’t actually mean physical emissions are increasing overall, just that assets are swapping hands. Where the physical changes are taking place reveals some fundamental structural changes sweeping Australia’s energy and economic landscape.
Firstly, black coal generators are the primary victims of energy efficiency, growth in renewable energy and manufacturing rationalisation. Macquarie, Delta, CS Energy, Gladstone, and Eraring have all seen major declines in their emissions. Also, once you adjust for Stanwell’s acquisition of Tarong the overall emissions of all the assets within the corporate group are down 1.1 million tonnes relative to 2008-09. In addition, the older brown coal generators are also getting hit with Energy Australia, HRL and Alinta Energy all seeing declines (although Alinta’s emissions are complicated by a corporate restructure of assets from the old Babcock and Brown Power).
The second big change is the rationalisation of metal production - hurt by a high Australian dollar. Bluescope Steel, Alcoa, Queensland Alumina, and Hydro Kurri Kurri all experienced significant declines in production and emissions.
On the counter side is the growth of iron ore and LNG, with Rio Tinto, Fortescue and Woodside all seeing their emissions increase. Expect to see LNG companies take up far bigger prominence in the years to come but iron ore mining is not all that emissions-intensive, so even though production will expand markedly, the emissions impact won’t be huge.
As a side issue I’d like to make a plea for transparency – can the Clean Energy Regulator please publish emissions data by physical facility and not just corporate group?
Corporate groups change names and shapes through the stroke of a pen while often little changes in terms of physical assets and pollution. This makes it incredibly difficult to assemble a sensible picture of what’s really going on with Australia’s emissions over time. This year represented a major breakthrough for transparency with the regulator publishing data by individual power station. But it needs to apply the same transparency to other sectors.
Arguments that this is commercial in confidence are largely rubbish because immediate competitors have vastly better data at their fingerprints than what might be available via the National Greenhouse and Energy Reporting system.


