The real future for solar, minus the target
ACIL Allen’s preliminary modelling for the Review of the Renewable Energy Target, outlined at a modelling workshop held on June 23, provided a very optimistic assessment of the impact of removing the Small-scale Renewable Energy Scheme (SRES), based on some unlikely assumptions.
This paper provides an alternative assessment of the likely impact of axing the SRES, based on the detailed and first-hand experience and expertise of the REC Agents Association (RAA), a national industry body for companies that create and trade in renewable energy certificates. This report utilises expert solar industry analysis, which has been used to inform the setting of the annual Small-scale Technology Percentage (STP), a key part of the SRES architecture.
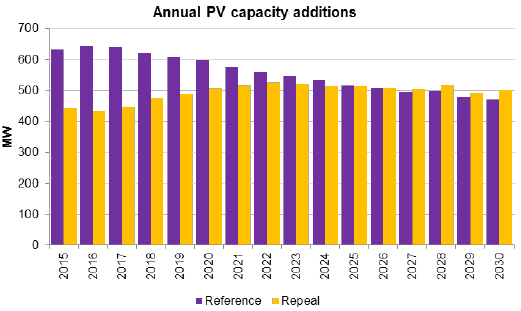
ACIL Allen, the consultants engaged by the panel to assess the impact of the RET, outlined that their regression modelling based on system payback showed that the level of solar installations would only fall by 30 per cent if the SRES was removed (refer to Figure 1).
Figure 1: PV Installations (ACIL Allen, Slide 19)

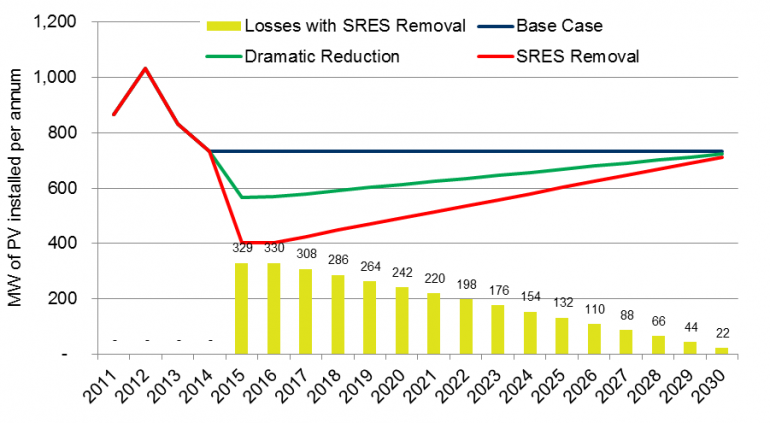
We believe demand for solar will fall much more substantially.
Figure 2: PV Installations (REC Agents Association)

ACIL Allen advised that there was limited empirical evidence to document changes in the solar PV market arising from changes in policy settings. This is surprising as we have witnessed significant changes in policy support over the last five years with a dramatic impact on solar PV installations.
The number of residential solar PV installations fell from 350,000 systems in 2011 and 330,000 systems in 2012 to approximately 200,000 in 2013 and we are currently on track to install approximately 170,000 residential systems in 2014 (Refer to Figure 3). This is nearly a 50 per cent reduction in the number of system installations from 2012 to 2014 driven by changes to state and Commonwealth government policy settings.
Figure 3: Residential PV Installations (Green Energy Markets STC Target Modelling, Feb 2014) (CLICK TO ENLARGE)
(Note: 2012 was used as a 'base case' due to a reduced multiplier and increased system size in comparison to 2011, so as to provide a more balanced comparison.)
If we were to reconstruct financial payback levels for solar PV over these two periods we see that the payback for a typical 3kW system installed increased from 5.2 years in 2012 (when feed-in tariffs and solar credits multiplier applied) to 7.2 years in June 2014.
Figure 4: Payback parameters for typical 3kW system (2012 and 2014 comparison) (CLICK TO ENLARGE)
(Note: the cost of electricity 'import power prices' does not include the fixed network costs payable by consumers for the poles and wires'.)
System costs have reduced the level of support via STCs and feed-in tariffs have dramatically reduced between 2012 and 2014. Subsequently, we have seen the level of residential installations reduce by nearly 50 per cent (from 331,175 to 173,058 systems) when the payback increased by two years to 7.2 years in 2014.
If we were to remove the value of small-scale technology certificates (which are currently worth $2295 for a 3kW system) then the upfront cost of a PV system increases by 44 per cent and the payback increases from 7.2 years to 10.1 years. This is nearly a three-year increase in payback and is longer than the average period that people are staying in their homes, of nine years (RP Data).
The 30 per cent reduction in PV systems installed assumed by ACIL Allen that arises from a 44 per cent increase in the upfront cost to consumers just does not stack up in the face of experience to date. Based on historical analysis, installations fell almost 50 per cent with an increased payback of two years. An additional three-year increase in payback must be assumed to at least have a similar impact on the level of system installations.
Modelling undertaken by expert solar consultant SolarBusinessServices indicates that the removal of the RET would lead to a 40 to 50 per cent reduction in the level of solar PV installations. This is a conservative estimate and may yet prove to be optimistic. The level of solar PV installations may be considerably lower.
A lower volume market will lead to some loss in unit economies and higher prices than would otherwise be the case. This arises due to (i) volume discounts will be less likely in Australia, (ii) Businesses will exit the market meaning less marketing and promotion and (iii) with lower volumes businesses will need to increase prices to recover fixed costs.
There will continue to be a level of solar PV installations, in the absence of support provided by the RET. While there will be some customers that are happy with a 10-year payback, the expectation is that solar PV will no longer be a compelling value proposition and customer acquisition costs will increase substantially.
The RET has been very important in making solar PV affordable for households and businesses and its removal will have a dramatic impact on the level of solar installations and on the solar industry more generally – much more than the 30 per cent reduction indicated by ACIL Allen.
Ric Brazzale is managing director of Green Energy Trading and president of the REC Agents Association.


