The 'average Joes' flirting with climate risk
What are the chances of being involved in a life threatening car accident, not just any car accident, a car accident where the air bags go off and you’ll need hospital treatment?
The probability is pretty low. Victorian statistics indicate that the incidence of fatal injuries per vehicle is 0.0067 per cent, and the incidence of an acute hospitalisation over 14 days per vehicle is 0.17 per cent. If you take out the circumstances where the person injured was completely reckless through being drunk or driving ridiculously fast, which most of us can easily avoid doing, then the probability is no doubt even lower again.
So does this mean all this effort and money we’ve put into car safety features, policing and advertising was a waste of time?
Somehow we’ve all got our head around the idea that when it comes to car safety, even though the chances of severe accidents are low, the consequences are so severe that it's worth spending several hundred dollars per household on prevention that keep this risk very low.
Climate change is no different. People like Bjorn Lomborg often like to cite the middle of the road, or average estimate, of temperature rise that we might experience from carbon emission projections, and focus on shorter time periods to suggest that we shouldn’t be too worried. They suggest that people talking of dire consequences and demanding we reduce emissions are just being excessively alarmist.
But it’s not really the average outcome that we need to manage against. The average outcome for most drivers is they don’t experience a very serious accident. Some drivers are even lucky enough to never have an accident of any kind other than maybe a bumper scrape throughout their life.
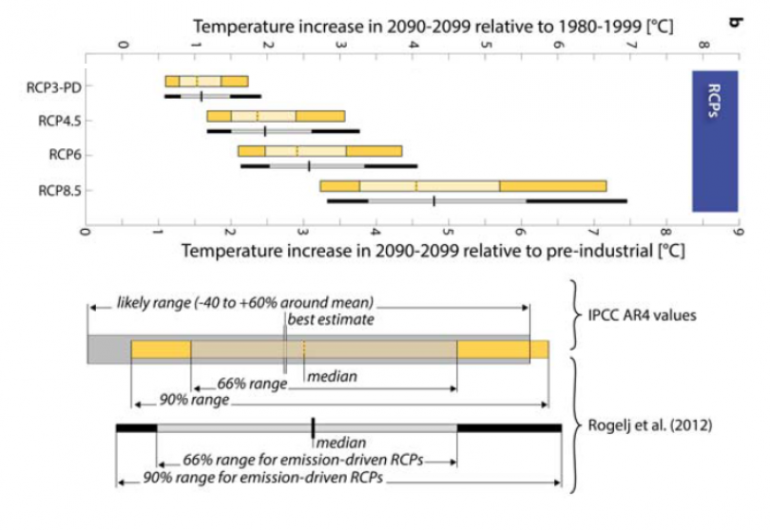
Our charts of the week help to illustrate how temperature rise estimates from rising carbon emissions are in fact span of probability where very severe outcomes and far more benign outcomes are possible.
The chart below shows the estimates of temperature rise by around 2100 expected from four different IPCC scenarios (known as Representative Concentrated Pathways, or RCPs, where the numbers represent energy as heat per square metre across Earth – i.e. RCP 2.6 is the lowest warming measure) for future carbon emissions, relative to pre-industrial times and also the average of temperatures in 1980 to 1999. It illustrates the median estimate but also shows the range of temperature rises likely with 66 per cent probability and 90 per cent probability.

Source: Chapter 12 of IPCC’s Working Group 1 Physical Science – Fifth Assessment Report
To put these results in context, 4 degrees would involve some incredibly severe consequences as detailed by a World Bank report released this year. Also a journal article by Steven Sherwood and Matthew Huber explains that a 7 degree rise would make land areas around the equator practically uninhabitable, due simply to unbearable heat stress.
Many environmentalists bang on about 2 degree warming above pre-industrial temperatures being the critical threshold. But the cold reality is that it is exceedingly unlikely that we’ll get the political agreement soon enough to ensure temperature rise is kept below 2 degrees (from pre-industrial) with 100 per cent certainty. By focussng on a single temperature rise number instead of talking about keeping the risk of catastrophic temperature rises very low, environmentalists can play into the hands of people like Lomborg.
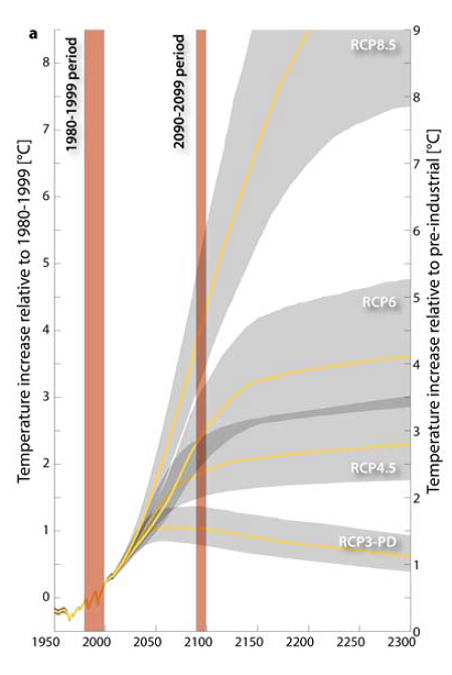
Take, for example, the way the IPCC report communicated the results of its temperature rise projection work in its Summary for Policy Makers. It said the mean temperature rise by 2100 under scenario RCP 4.5 was 1.8 degrees while under RCP 6 it would be 2.2 degrees (note that’s above 1980 to 1999 average temperature, not pre-industrial). If you’re Lomborg you say there’s barely any difference between these two results, so why must we keep emissions to levels in RCP4.5, which are vastly lower and harder to achieve than RCP 6?
The chart below helps to explain why. Firstly, under RCP 6 we see a lot more temperature rise locked in after 2100 than under RCP 4.5. Now, while the difference in the average temperature rise (yellow line) in 2100 doesn’t seem all that different, the differences in the bounds (grey shading) of possible rises are huge, and this chart only shows the bounds within the 66 per cent confidence level, not 90 per cent.

If we choose to emit carbon emissions at the levels implied by RCP 6 we expose future generations to risks with far greater probability than a severe car accident, that would be utterly catastrophic for large portions of humanity. RCP 4.5 is also very dangerous, but at least we reduce the probability of 4 degrees or higher to very low levels. If we were to choose the lowest emission scenario we can reduce the probability of the catastrophic possibilities to quite low levels.
The likely cost of keeping emissions below those in the RCP4.5 scenario versus RCP6 would be within a similar realm to how much households already spend on preventing and insuring against severe motor vehicle accidents. Now yes, the severe consequences of a car accident are far more immediate than those of climate change, but much less far reaching.


