The ASX200: A concentrated mix


Summary: Our share market, and index funds based on it, is no longer overly concentrated in bank and resource companies – just banks and now more so. |
Key take-out: Investors may not be getting the diversification they seek when investing in unlisted and listed index ETFs and funds that largely track it. Dilution is needed to control this risk. |
Key beneficiaries: General investors. Category: Strategy. |
Back in June 2012 (Goodbye to the 'All Ordinaries') we deconstructed the Australian share market, revealing which sectors and companies drove the performance of our market, and therefore the multitude of index funds and ETFs based on it. I warned then:
Our share market is the second most concentrated in the developed world. Our top 10 stocks make up more than half of the market. The market could be described as “debt , dirt and diversified” (banks, resources and other).
Ours is a highly cyclical market and the third least defensive developed market. Growth or cyclical stocks make up 80 per cent of the market. Defensive sectors account for only 20 per cent.
Since then our share market has risen, and probably not surprisingly now fallen more than other developed markets. In this article we revisit what now makes up our stock market and answer the questions: has much changed and what should you do?
Market value up but resources squeezed
Figure 1, below, shows the industry and major company share composition of the ASX200 index back on June 1 2012 and now at September 1 2015.
First the good news: the combined value of the biggest 200 companies in Australia has risen $290 billion in value from $1.1 trillion to $1.4trn – which hopefully you can see by the larger area the lower chart occupies.
Assuming a dividend yield of roughly 4 per cent, over this three-year period companies have also paid out $150bn in dividends not shown. During this time the ATO has probably also mailed out several billion dollars in franking credit refunds to pension investors – something I'm sure it would love stop doing disguised as tax reform.
When the bell rung signalling what I believe was the peak in bond and share market prices around April Fool's Day this year (see From tailwinds to headwinds), the value of these 200 companies topped $1.6trn.
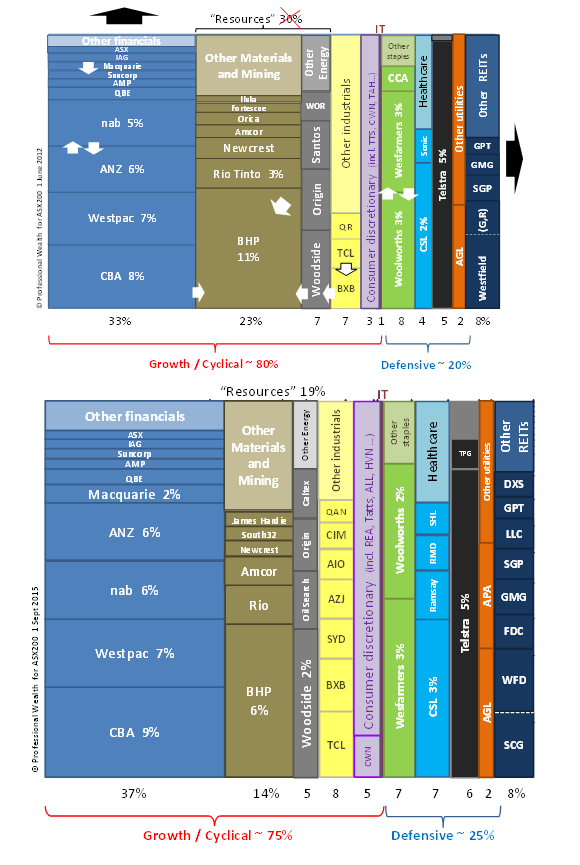
Figure 1: Industry sector and major company share (>0.5 per cent) composition of the ASX200 on 1 June 2012 (above) and 1 Sept 2015 (below).
Since June 2012, only two sectors are worth less (no, not worthless!). Materials including mining, and energy stocks are worth $60bn-$10bn less now. All other sectors rose by a combined $350bn in value therefore limiting our overall market growth to $290bn.
The resource sectors have literally been squeezed and now make up a combined 19 per cent of the market, not a portfolio bulging 30 per cent as they were three years ago. Earlier I worried index funds (both exchanged traded ETFs and unlisted funds) based on our market came with an over exposure to this volatile sector prone to boom and bust.
The good news is this sensitivity is meaningfully reduced. The bad news is it cost investor money to fix.
The financial sector, which is about 80 per cent made up of banks, has increased in importance from 33 to 37 per cent of the market – peaking in April at nearly 45 per cent. In an ideal portfolio construction, my rule would be to limit any industry exposure to 30 per cent (and shareholding to 10 per cent). That dream is even a further away if you are an index investor.
The next biggest change in the makeup of our market is the nearly doubling in value of the portfolio-important defensive and diversifying health care sector from four to seven per cent of the market. Dominant CSL which made up half this sector, still does, which means it's not alone in having a stellar performance. Newly appearing in the chart are Ramsay and Resmed which along with Sonic Healthcare each represent more than 0.5 per cent of the market – so earning a call-out in this chart, hidden before.
IT doesn't even make up a 1 per cent sliver in Figure 1. It includes $10bn worth of market valued Computershare, carsales.com.au, IRESS and Technology One however it probably should include $4bn SEEK counted instead as an industrial company. Sadly for Australia and Australian investors this still doesn't count for much.
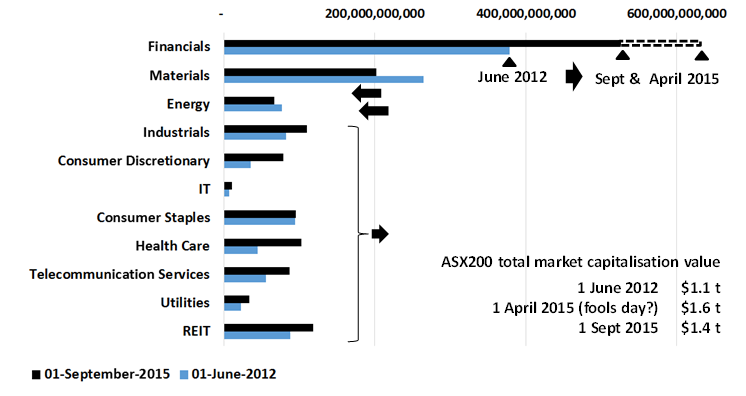
Changing industry sector values and returns
The change in overall market and industry sector value is shown in Figure 2. While all but the Materials and Energy sectors grew, defensive Consumer Staple stocks grew only marginally. This was due to major component Woolworths' underperformance which saw it fall from first to second largest consumer staple stock, overtaken by diversified Wesfarmers.
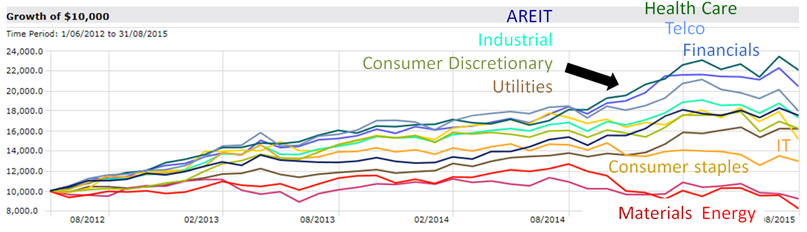
Counting dividends which are included in the lower part of Figure 2, investors in the Health Care sector and Telecommunication Services sector (aka “Telstra”) doubled their money in a little over three years. Investors in the next best performing financial sector would have grown their money a little less. Most of this was due to upwards pricing following:
June 2012 Greek Financial Crisis No. 27 (yes I made that number up) which depressed prices around that time; and
The yield boom that propelled high income shares to their peak in April 2015.
Accordingly our financial sector's value peaked at over $600bn. Investors, or perhaps it was just speculators, thought then our top four banks alone were collectively worth half a trillion dollars!
CSL takes out Rio as a top 10 index holding
BHP is the little smaller big Australian in Figure 3 list of top 10 index companies. This because the value of its shares listed in Australia have fallen, moving it from an earlier #1 default index investment component to #4. Rio Tinto also shrunk sufficiently to fall out of the top 10. This is of course due to the fall in commodity prices following a realisation perhaps China did build bridges to nowhere and towns for ghosts after all – well maybe I'm being a bit harsh.
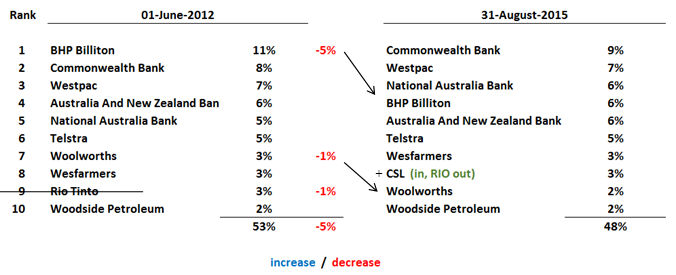
Note our index allocates accordingly to the value of stock listed locally. This means dual listed BHP and Rio are bigger companies than represented here. In fact at today's prices BHP is largely equal in value to CBA, but sadly its worth about half what it was at its peak in April 2011.
CSL after rising in value from $33 to $90 per share has earned its way into the top 10 companies and is now worth about $40bn. Earlier (Homemade dividends) I compared CSL to CBA and suggested you could use it instead to “make your own dividends” – that would have proved a profitable injection if followed.
As noted before the other mover in the top 10 was Woolworths. Down. However this is only because in this three year time frame it didn't grow with the rest of the industry - its current share price of about $27 is what it was in June 2012. However over the last two years its share price fell from a peak of $37 which was just long enough to cause the sacking of the Chairman and CEO.
Asset allocation implications
Today's quiz is about Figure 4 below: Which pie chart matches the industry sector mix of Australia and which one is the world stock market ex-Australia? Incidentally the world ex-Australia share market's largest light blue slice isn't financials but IT. Financials are second. The growing disruptive power of IT and the potential of “fintech” is perhaps a reason to worry about investing in Australia banks.
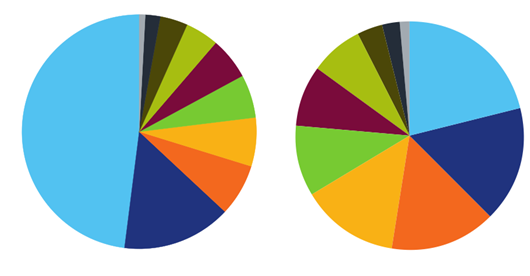
Figure 4: June 30 2015 sector make up of Australian and World stock market and index funds and ETFs based on them – obviously Australia is on the left!
While I remain a fan of index investing I'm not a fan of overly relying on Australia broad market indices like the ASX100, ASX200 or ASX300. If you are investing in the Australian share market just this way, doing so sensitises your portfolio and retirement to now one industry: banking. If you are also a direct property investor, given banks make most of their profits from property lending, then arguably you are doubling up on property – Australia's big economic Achilles heel.
If you have a large number of banking shares in your direct portfolio and invest into a broad market index fund to diversify, realise you're not. While of course direct share investors easily can diversify, most don't avoid concentrating their monies in too tempting, high dividend paying banks. I guess if you focus on income alone than that's no problem – unless such stocks also fall.
Most index fund suppliers are obsessed by the purity of the index and don't feel like prudently capping the sector mix - which they do in a few countries elsewhere. I think they should.
Bank concentration is an especially big problem in high yield funds and ETFs. ishares IHD does a better job than most controlling this risk and producing a prettier pie chart.
Another index supplier, Market Vectors, offers an equi-weight index fund MVW which holds about 60 stocks in about 1.5 per cent proportion but in doing so manages only to reduce the financials exposure to one third of the portfolio – though less banks. I'm still waiting for the industry to release an equal-sector or equal growth-defensive ETF I asked for three years ago.
Recently I wrote about the promise for midcap investment. The sector between the twentieth or fiftieth and the one hundredth biggest stocks is relatively diversified once our 'megacap' banks and miners are passed over. I listed a few funds that focus on this sector you can research, but an ETF is still missing. Investing in small companies is another way to reduce your sector allocation but if using a fund, one needs to avoid the very ordinary, easy-to-beat Small Ordinary index (it's not hard for companies to become part of this index and it's filled with junior miners) that some ETFs track and many fund managers greedily charge a performance fee off.
Probably the most practical way to avoid concentrating too much of your money into Australian banking shares is to invest also in offshore equities.
Sadly it was very easy to reduce your portfolio's exposure to resource companies over the last three years. You just had to have held them! Let's hope that's not how you reduce your bank exposure going forward.
Dr Douglas Turek is Principal Adviser with independently-owned family wealth advisory and money management firm Professional Wealth (www.professionalwealth.com.au)


