Solar a third of new US power capacity
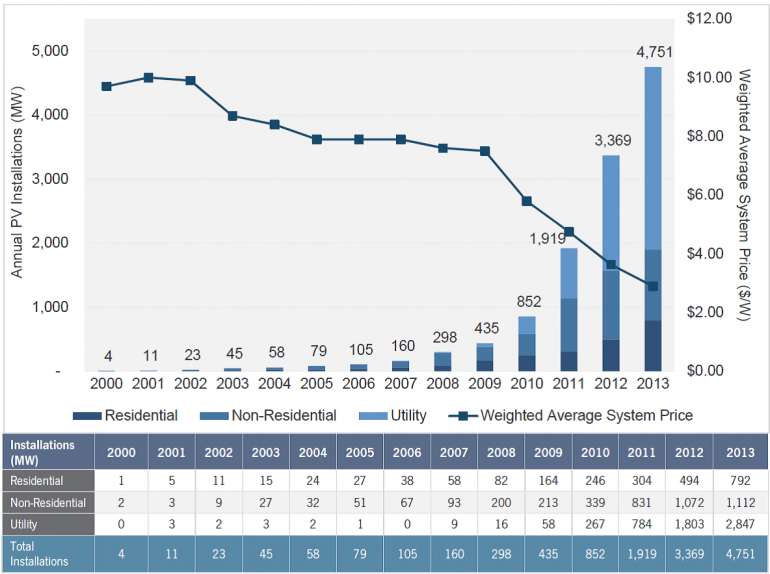
The figures are now in for US solar installations from GTM Research and the Solar Energy Industries Association – megawatts installed are up 41% on the prior year to 4751 megawatts with nearly half of it coming in the last 3 months of the year.
Our charts of the week are taken from the GTM’s 2013 Year in Review illustrating solar’s spectacular growth in the US.
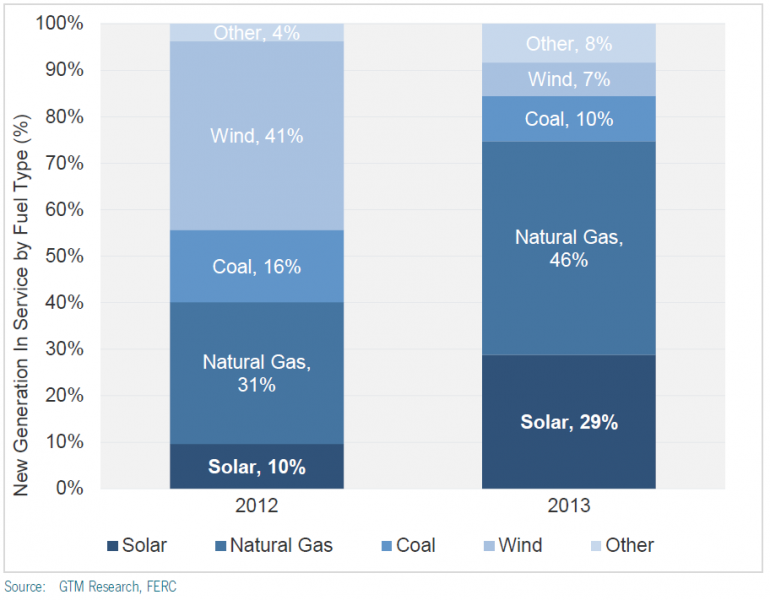
Solar now represents a major player in the US in terms of newly installed power generation capacity. It was second only to gas in 2013 making up 29% of new capacity installed and leapt past wind power. Wind power was actually the largest source of new capacity the prior year of 2012, but because of the failure of the US Congress to renew the wind investment tax credit until early in 2013, wind development was becalmed for a large portion of 2013, but looks like recovering in 2014. Also what’s not shown is power station retirements which significantly reduces the real growth in coal generating capacity in the US.
US newly installed power generation capacity by fuel type

The chart below illustrates system prices and capacity installed per annum. It should be noted that while the US has managed considerable year on year growth since 2009, it still trails well behind Australia in terms of PV capacity installed per head of population. For example we installed about half the capacity of what the US installed in 2011 and a third of what they installed in 2012 yet our population is less than a tenth of their’s.
US annual solar PV installations by market segment and system prices

Source:GTM Research - U.S. Solar Market Insight
Interestingly Australia’s system costs are equivalent or even lower that the US. This is quite surprising because, as the chart above shows, the lion’s share of PV installed in the US is commercial or utility-scale. This should mean a significant economy of scale advantage over Australian installations, which are about 90% residential systems of 5 kilowatts or less.
It seems solar PV installation is one area where Australia’s productivity leads the world.


