National accounts paint a positive growth picture


Summary: The June update on national accounts won't materially affect the outlook for rates, despite reporting strong improvement from the public sector and a timely boost in tax revenue. |
Key take-out: The national accounts were positive but investors should be wary that commodity prices may drift lower in the coming months. |
Key beneficiaries: General investors. Category: Economics, commodities. |
Other economic indicators may be more timely, but few have the capacity to move markets like the release of the national accounts. The quarterly snapshot of the Australian economy provides insight into conditions in the household and business sectors and identifies sources of strength and cause for concern.
The ABS released the national accounts for the June quarter on Wednesday and it was a solid outcome for the Australian economy. While the headline real GDP figure continues to overstate the strength in the Australian economy, the recent pick-up in commodity prices has seen national income growth begin to recover.
The result should be interpreted in a positive manner with regards to Australia's economic outlook. However, investors should be wary that commodity prices may drift lower in the coming months since the end of the year has historically been quite weak for commodities. Furthermore, while the result was a positive, it doesn't materially affect the outlook for interest rates.
Economic growth and commodity prices
The standard measure of economic growth is real gross domestic product (GDP), which measures the volume of production or income or expenditure that occurs in an economy over a specific period of time. Although there is three ways to measure real GDP they should all be equal since one person's expenditure is another person's income.
The recent decline in commodity prices has called into question whether real GDP is an appropriate measure of economic activity and living standards. Weaker commodity price and our terms of trade has dragged down domestic income growth. We have experienced an ‘income recession' for the past two years, which has seen the nation take a pay cut as mining profits plummeted.
In response I have come to prefer a measure of economic activity called real gross domestic income (GDI). This measure is similar to real GDP except that it makes an adjustment for changes in commodity prices and our terms of trade. For a small open economy, such as Australia, it is almost impossible to judge our economic performance without first considering the price of the exports that we sell abroad.
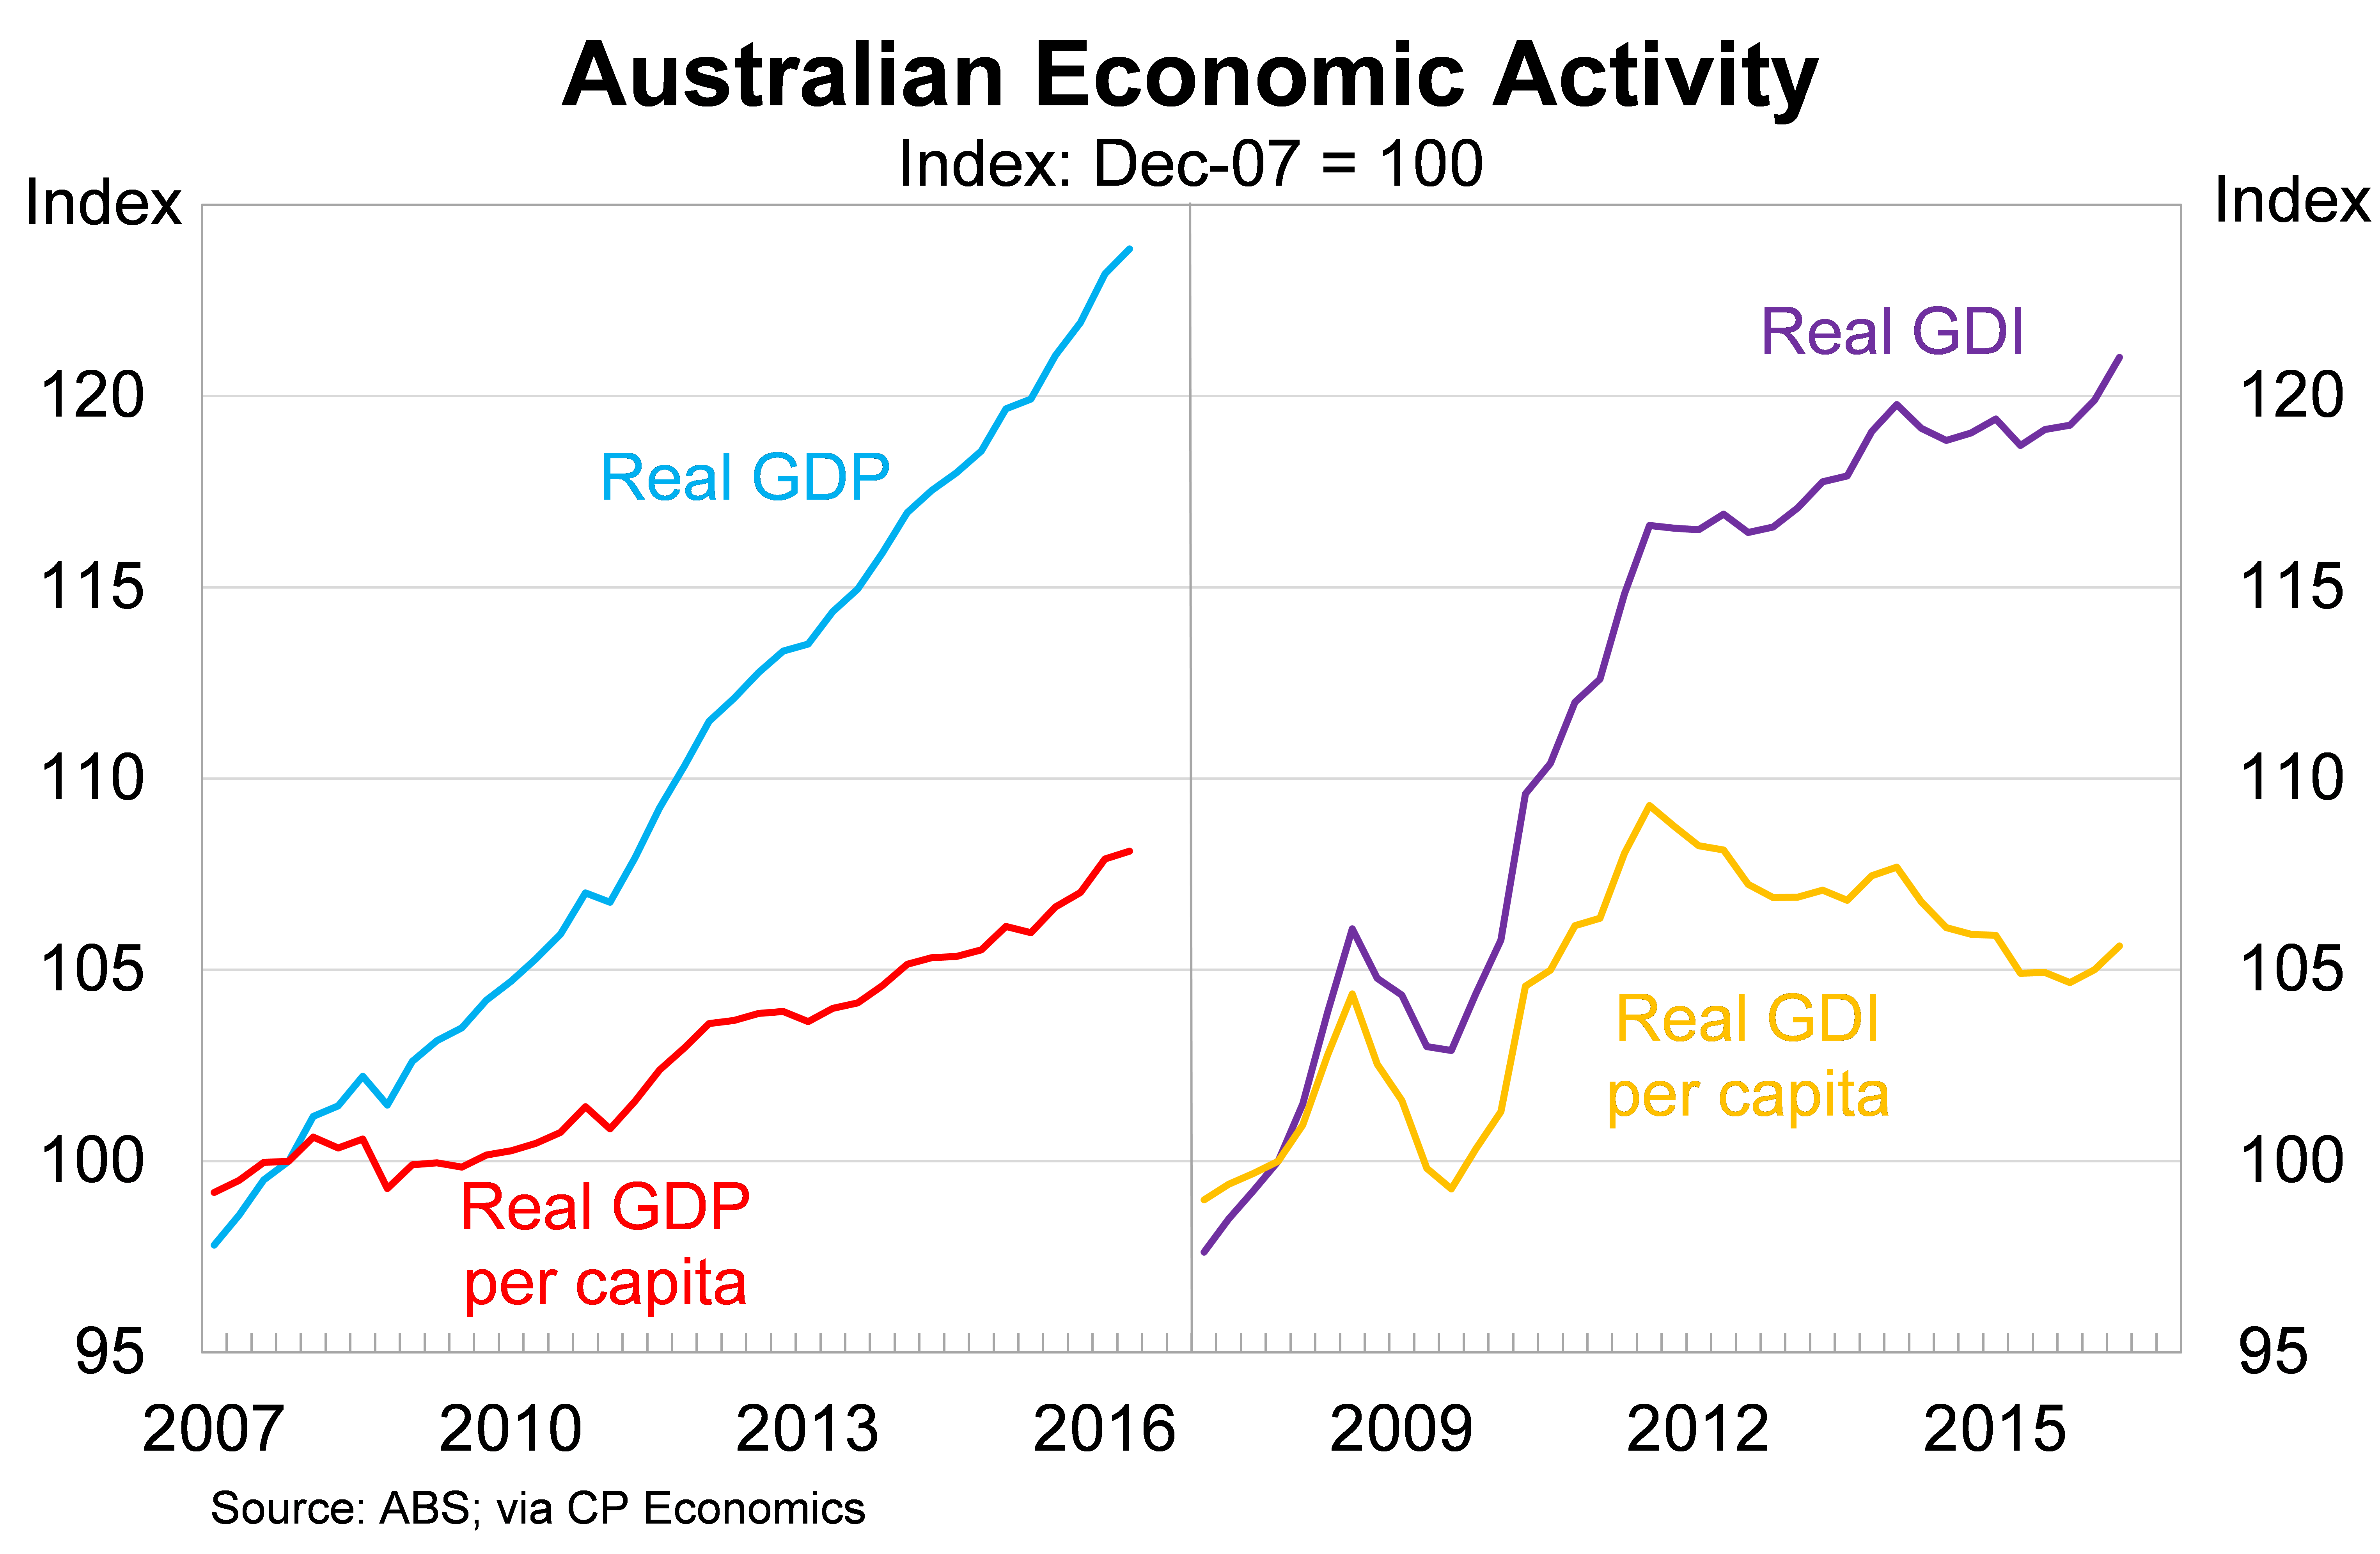
The graph below compares the two measures. Real GDP rose by 0.5 per cent in the June quarter, beating market expectations, to be 3.3 per cent higher over the year. By comparison, real GDI has increased by 1.9 per cent over the past 12 months with around half of that growth occurring in the June quarter.
The graph below does a good job of highlighting the impact that falling commodity prices have had on our economic performance. Real GDI per capita has fallen 3.4 per cent from its peak almost five years ago, which means that living standards have fallen throughout that period.
Officially the Australian economy is growing at what is considered an above trend rate – with trend considered to be annual growth of around 2¾ per cent – but most of that is due to strong demand for iron ore and coal. Domestic demand remains quite weak and that explains why inflation and interest rates currently sit either at or near historically low levels. Nevertheless, the result in the June quarter was a step in the right direction.
Household sector
Household spending accounts for around 55 per cent of real GDP. As a component of economic activity it is relatively stable, at least compared with the likes of business investment and residential construction. A healthy household sector is a prerequisite for a healthy economy and our household sector is doing better than you might expect given the ongoing weakness in wage growth.
Household consumption rose by 0.4 per cent in the June quarter, a little slower than earlier in the year, to be 2.9 per cent higher over the year. More timely data suggests that retail conditions have eased a little in recent months as the stimulus arising from higher asset prices, the so-called ‘wealth effect', begin to diminish.
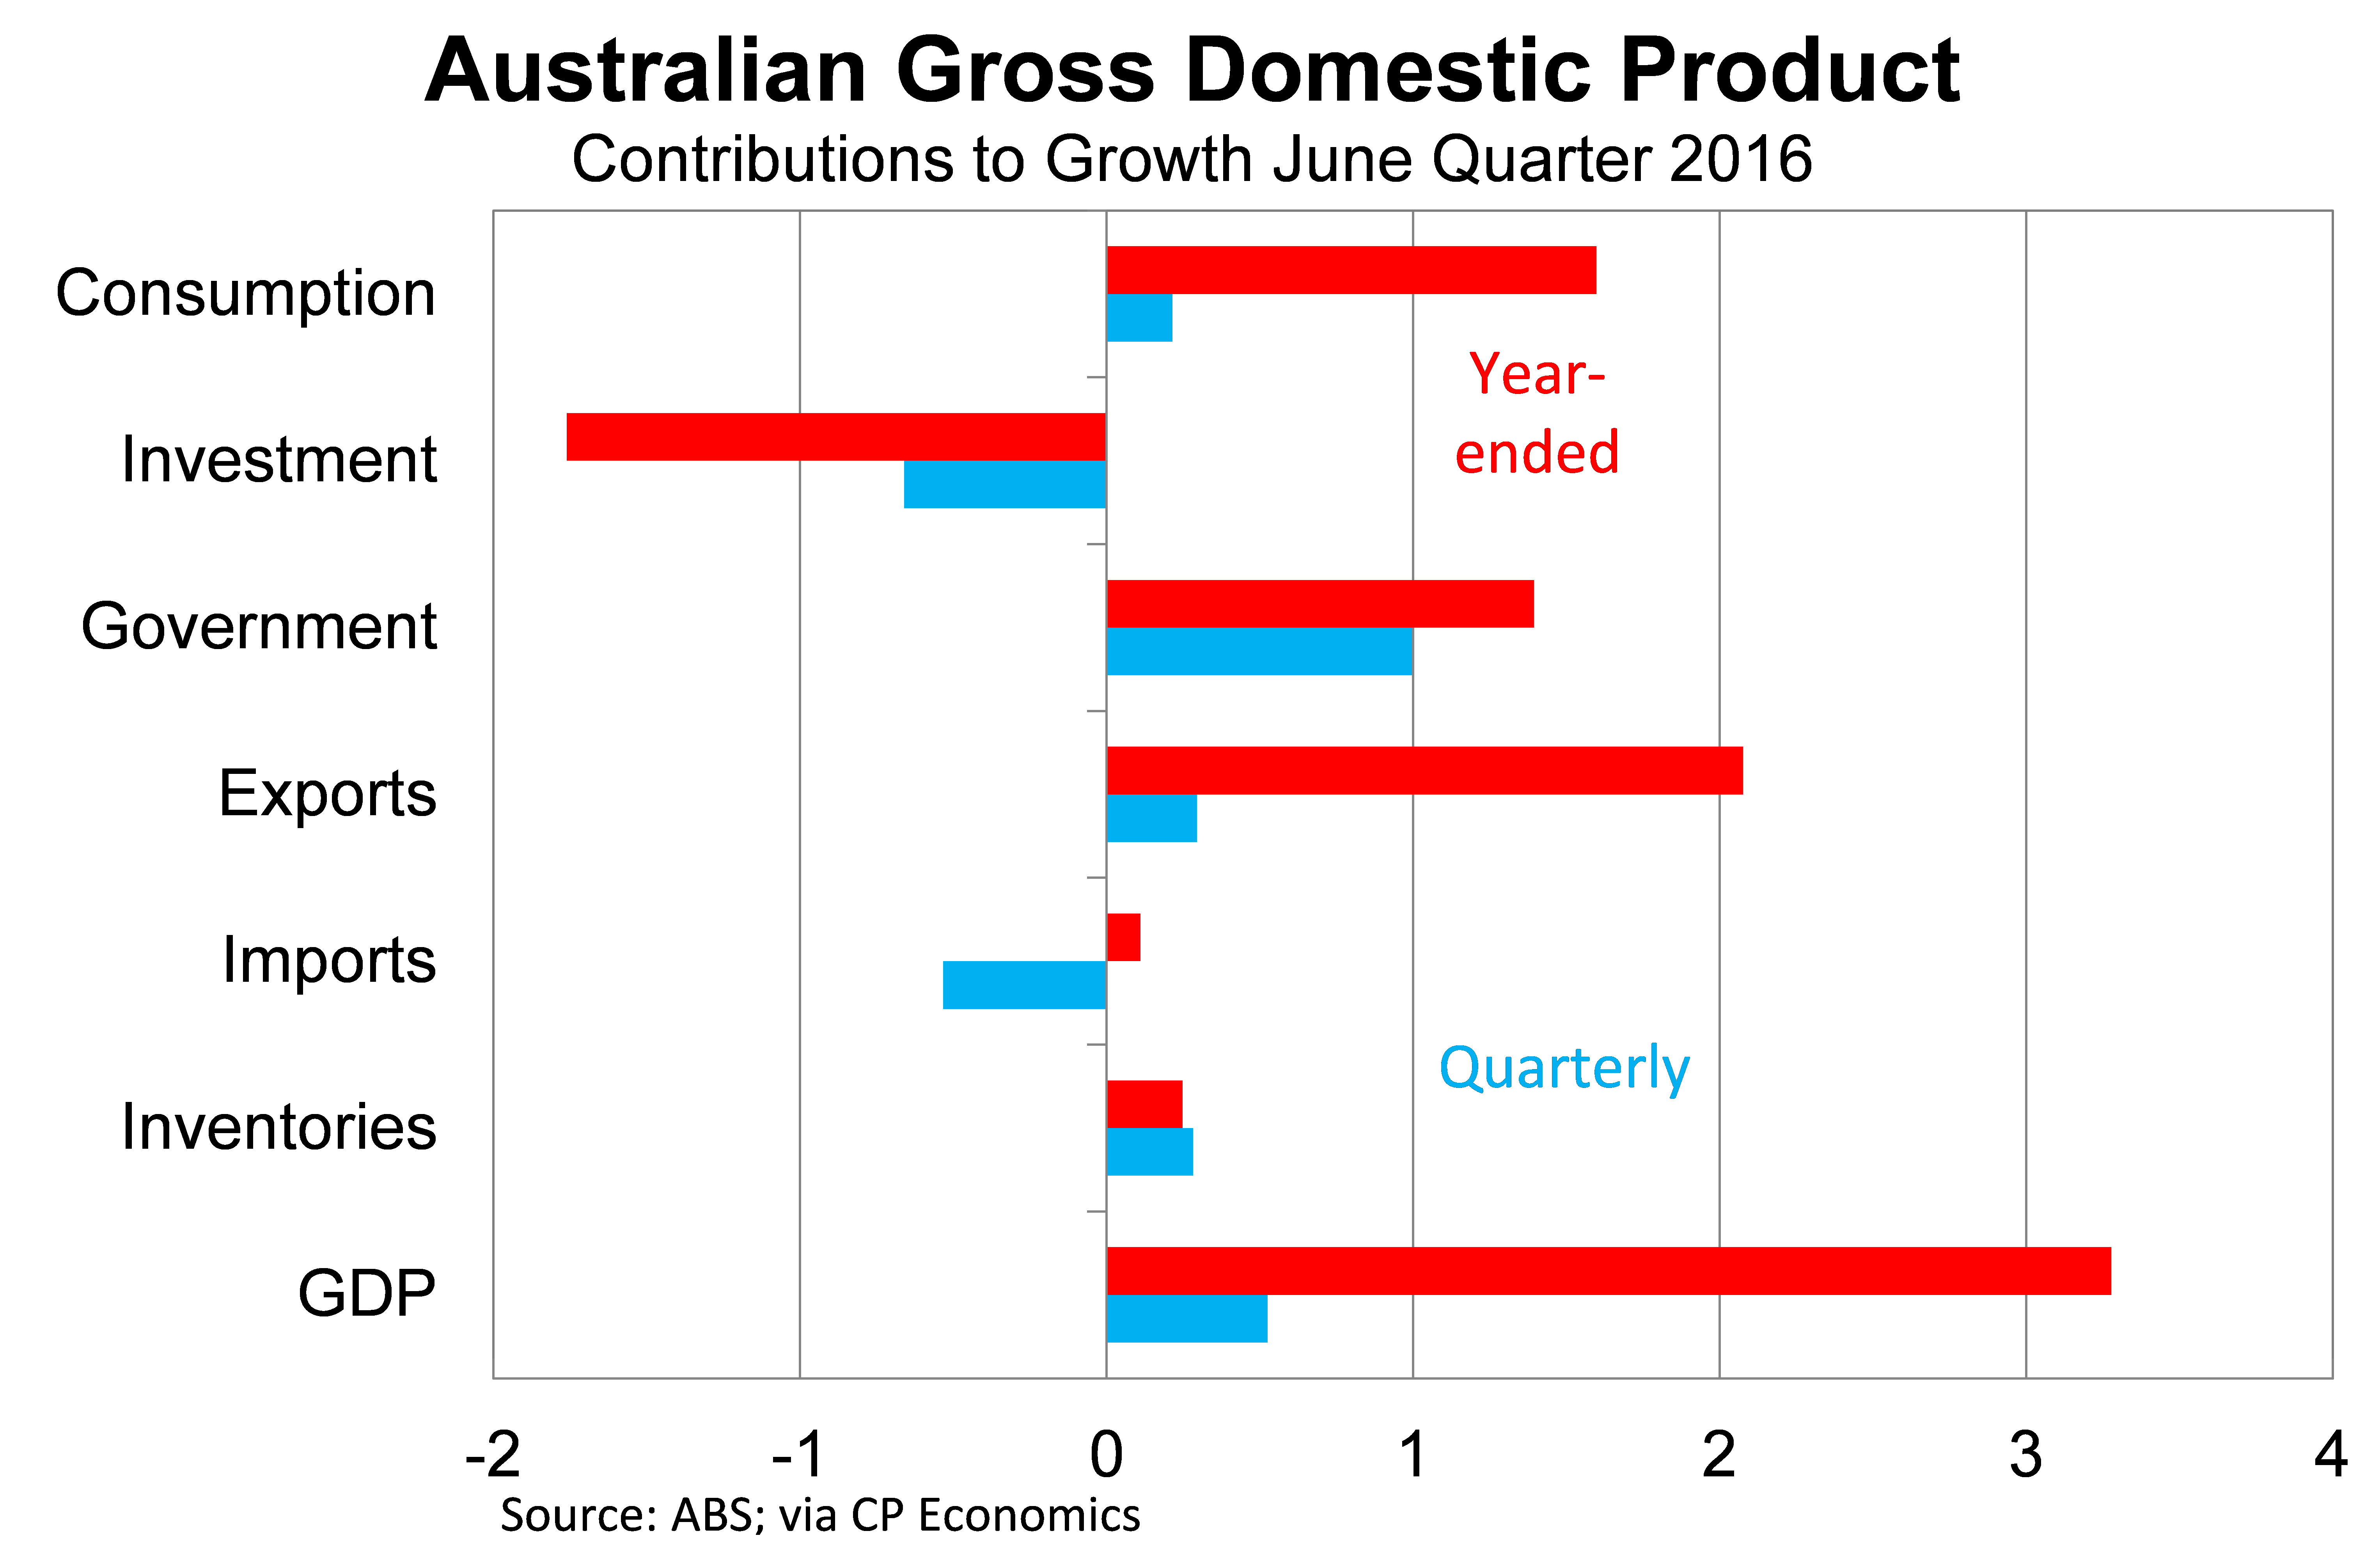
The graph below shows the contribution made by the major components of economic activity. With the exception of net exports, no sector has been as important to our recent economic performance as household spending.
Residential construction has been another bright spot for the Australian economy but the June quarter suggests that the boom is beginning to stabilise. Residential construction rose by 0.2 per cent in the quarter and now accounts for 3.6 per cent of economic activity. This shift towards stabilisation should continue with building approvals remaining at an elevated level and that activity should be sufficient to contain house price growth over the next few years.
Business sector
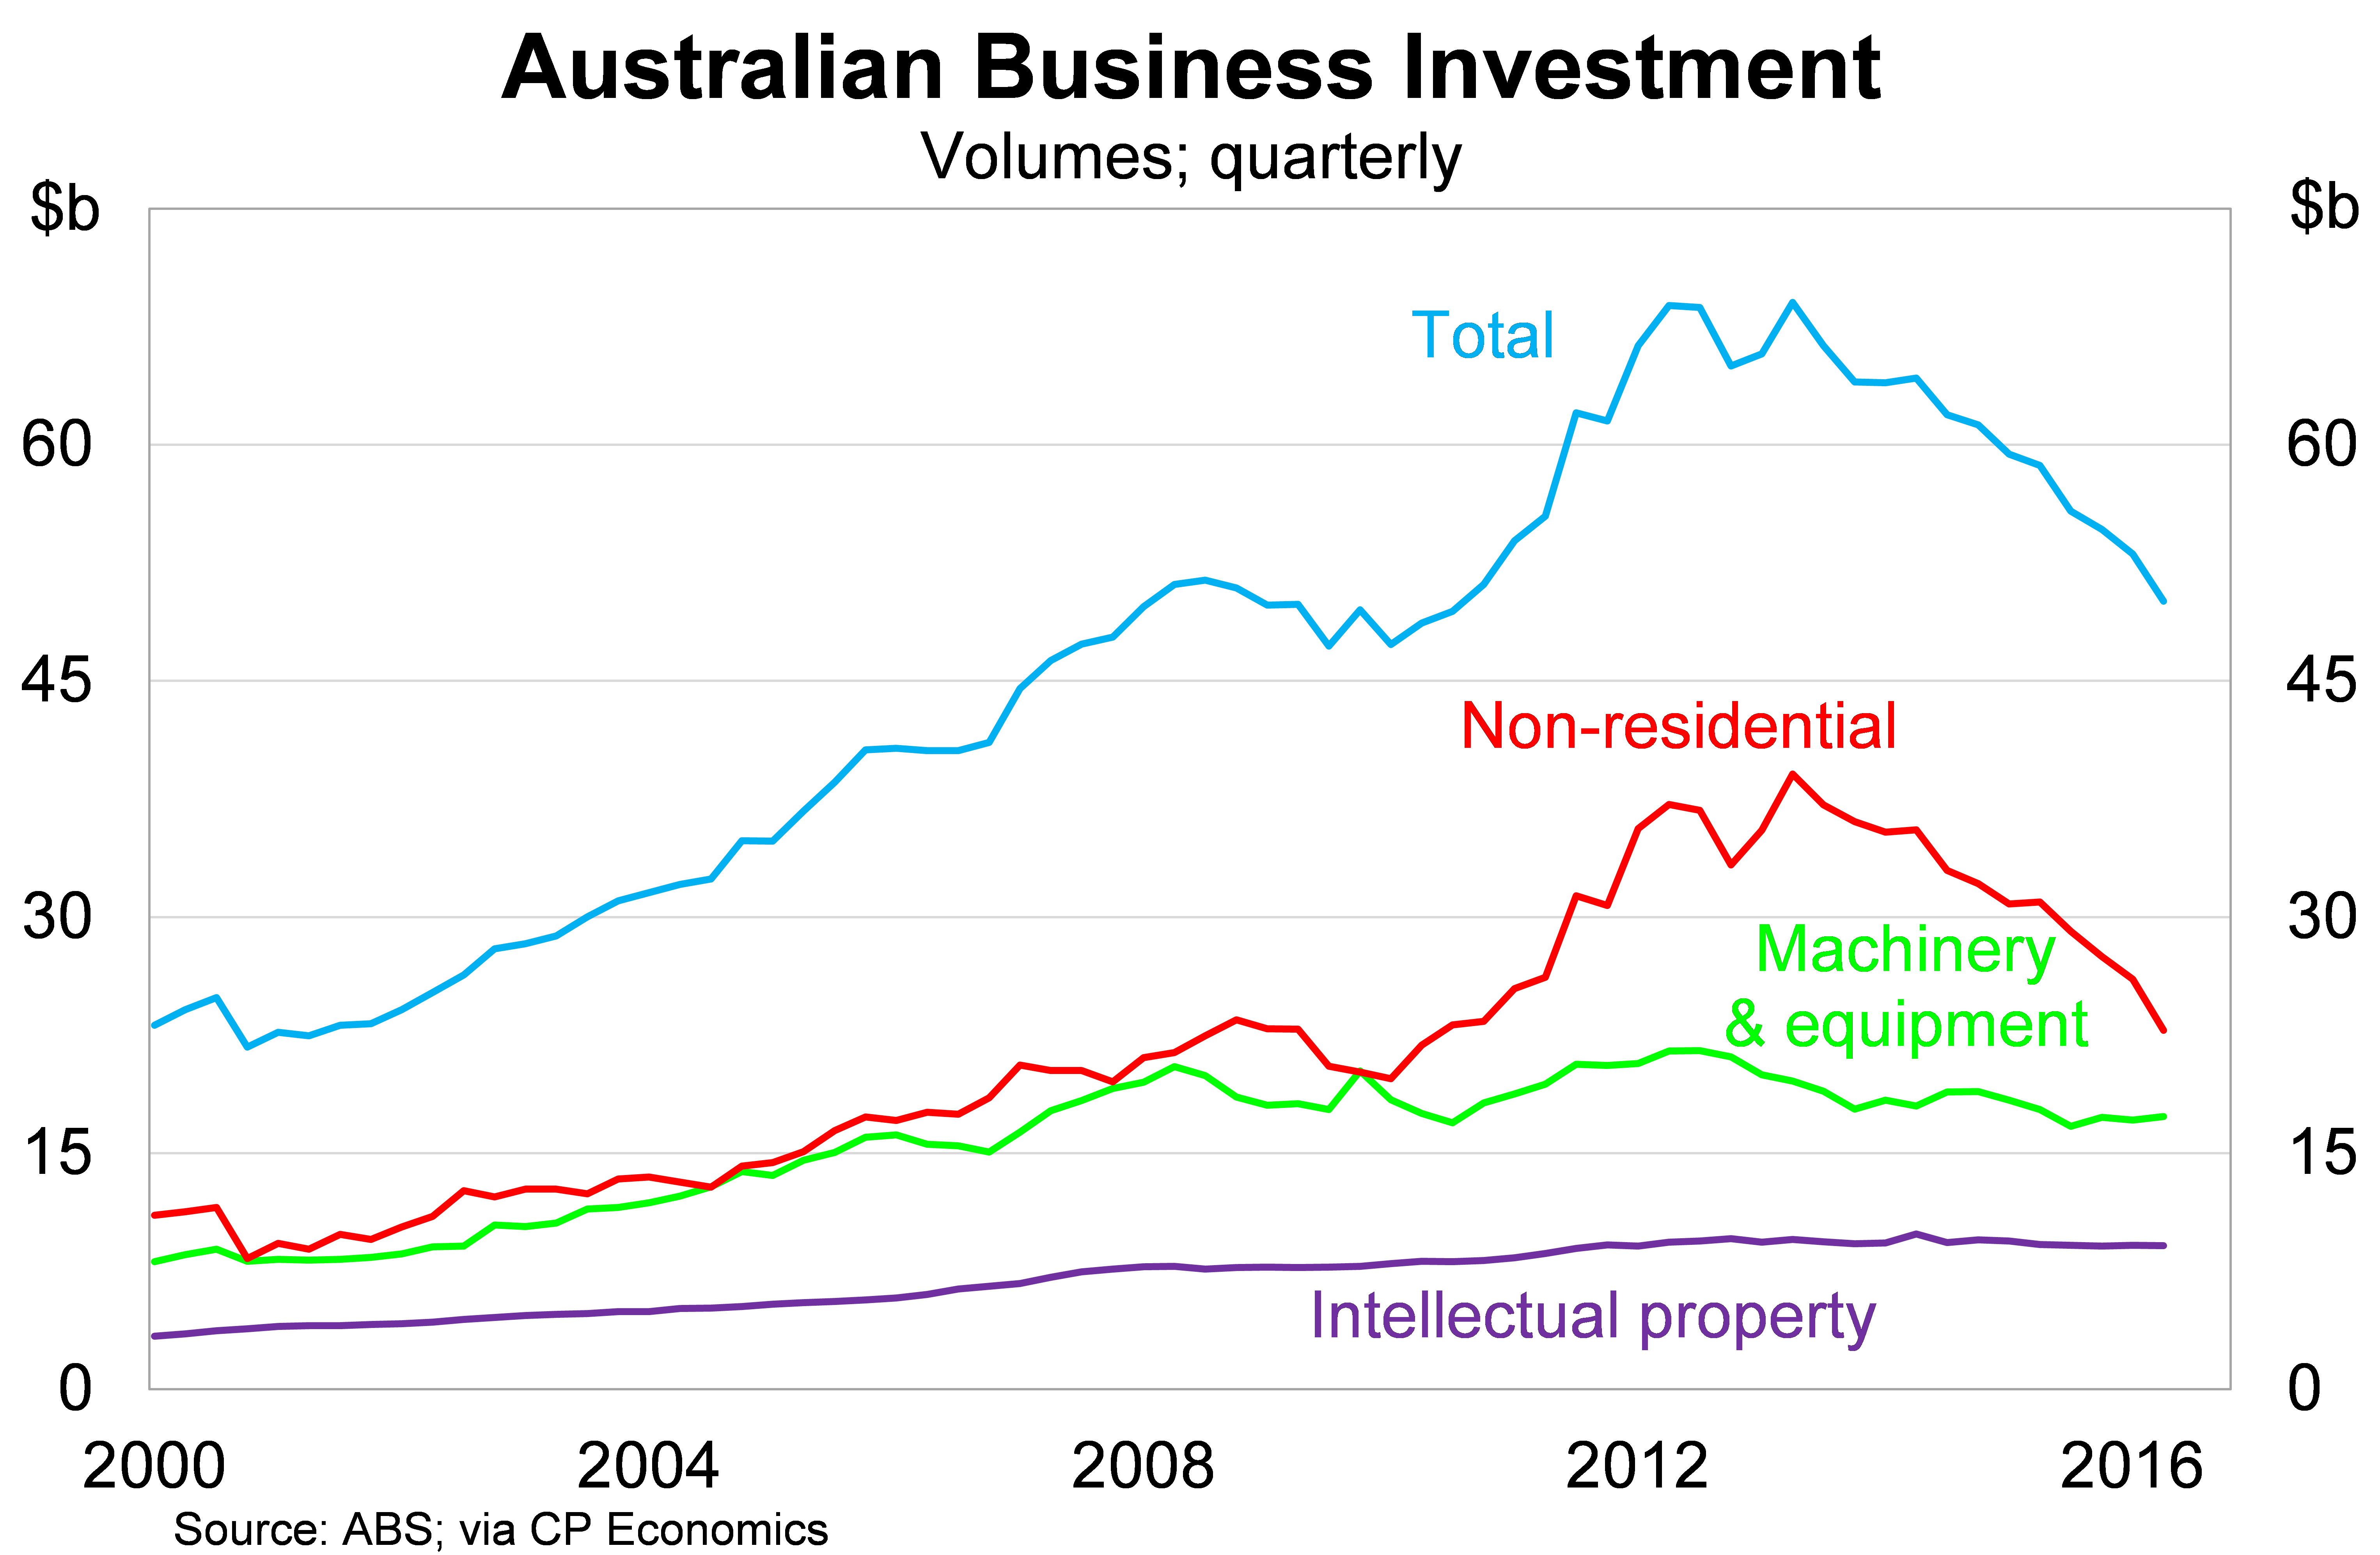
Business investment is one of the more volatile components of economic activity and has been a key source of weakness for the Australian economy over the past few years. The end of the mining investment boom is a major reason why the Reserve Bank has cut interest rates. So far lower rates hasn't had the effect on business investment that many analysts predicted.
Business investment fell by 5.7 per cent in the June quarter, consistent with the result from the recent capital expenditure survey, to be 14.7 per cent lower over the year. Non-residential investment fell by a remarkable 12.4 per cent in the June quarter.
Business investment has now fallen 27.5 per cent from its peak, with another 10 to 15 per cent fall expected during the 2016-17 financial year. The weakness in investment will continue to weigh on full-time employment and if persistent will undermine the performance of domestic equities.
Government spending
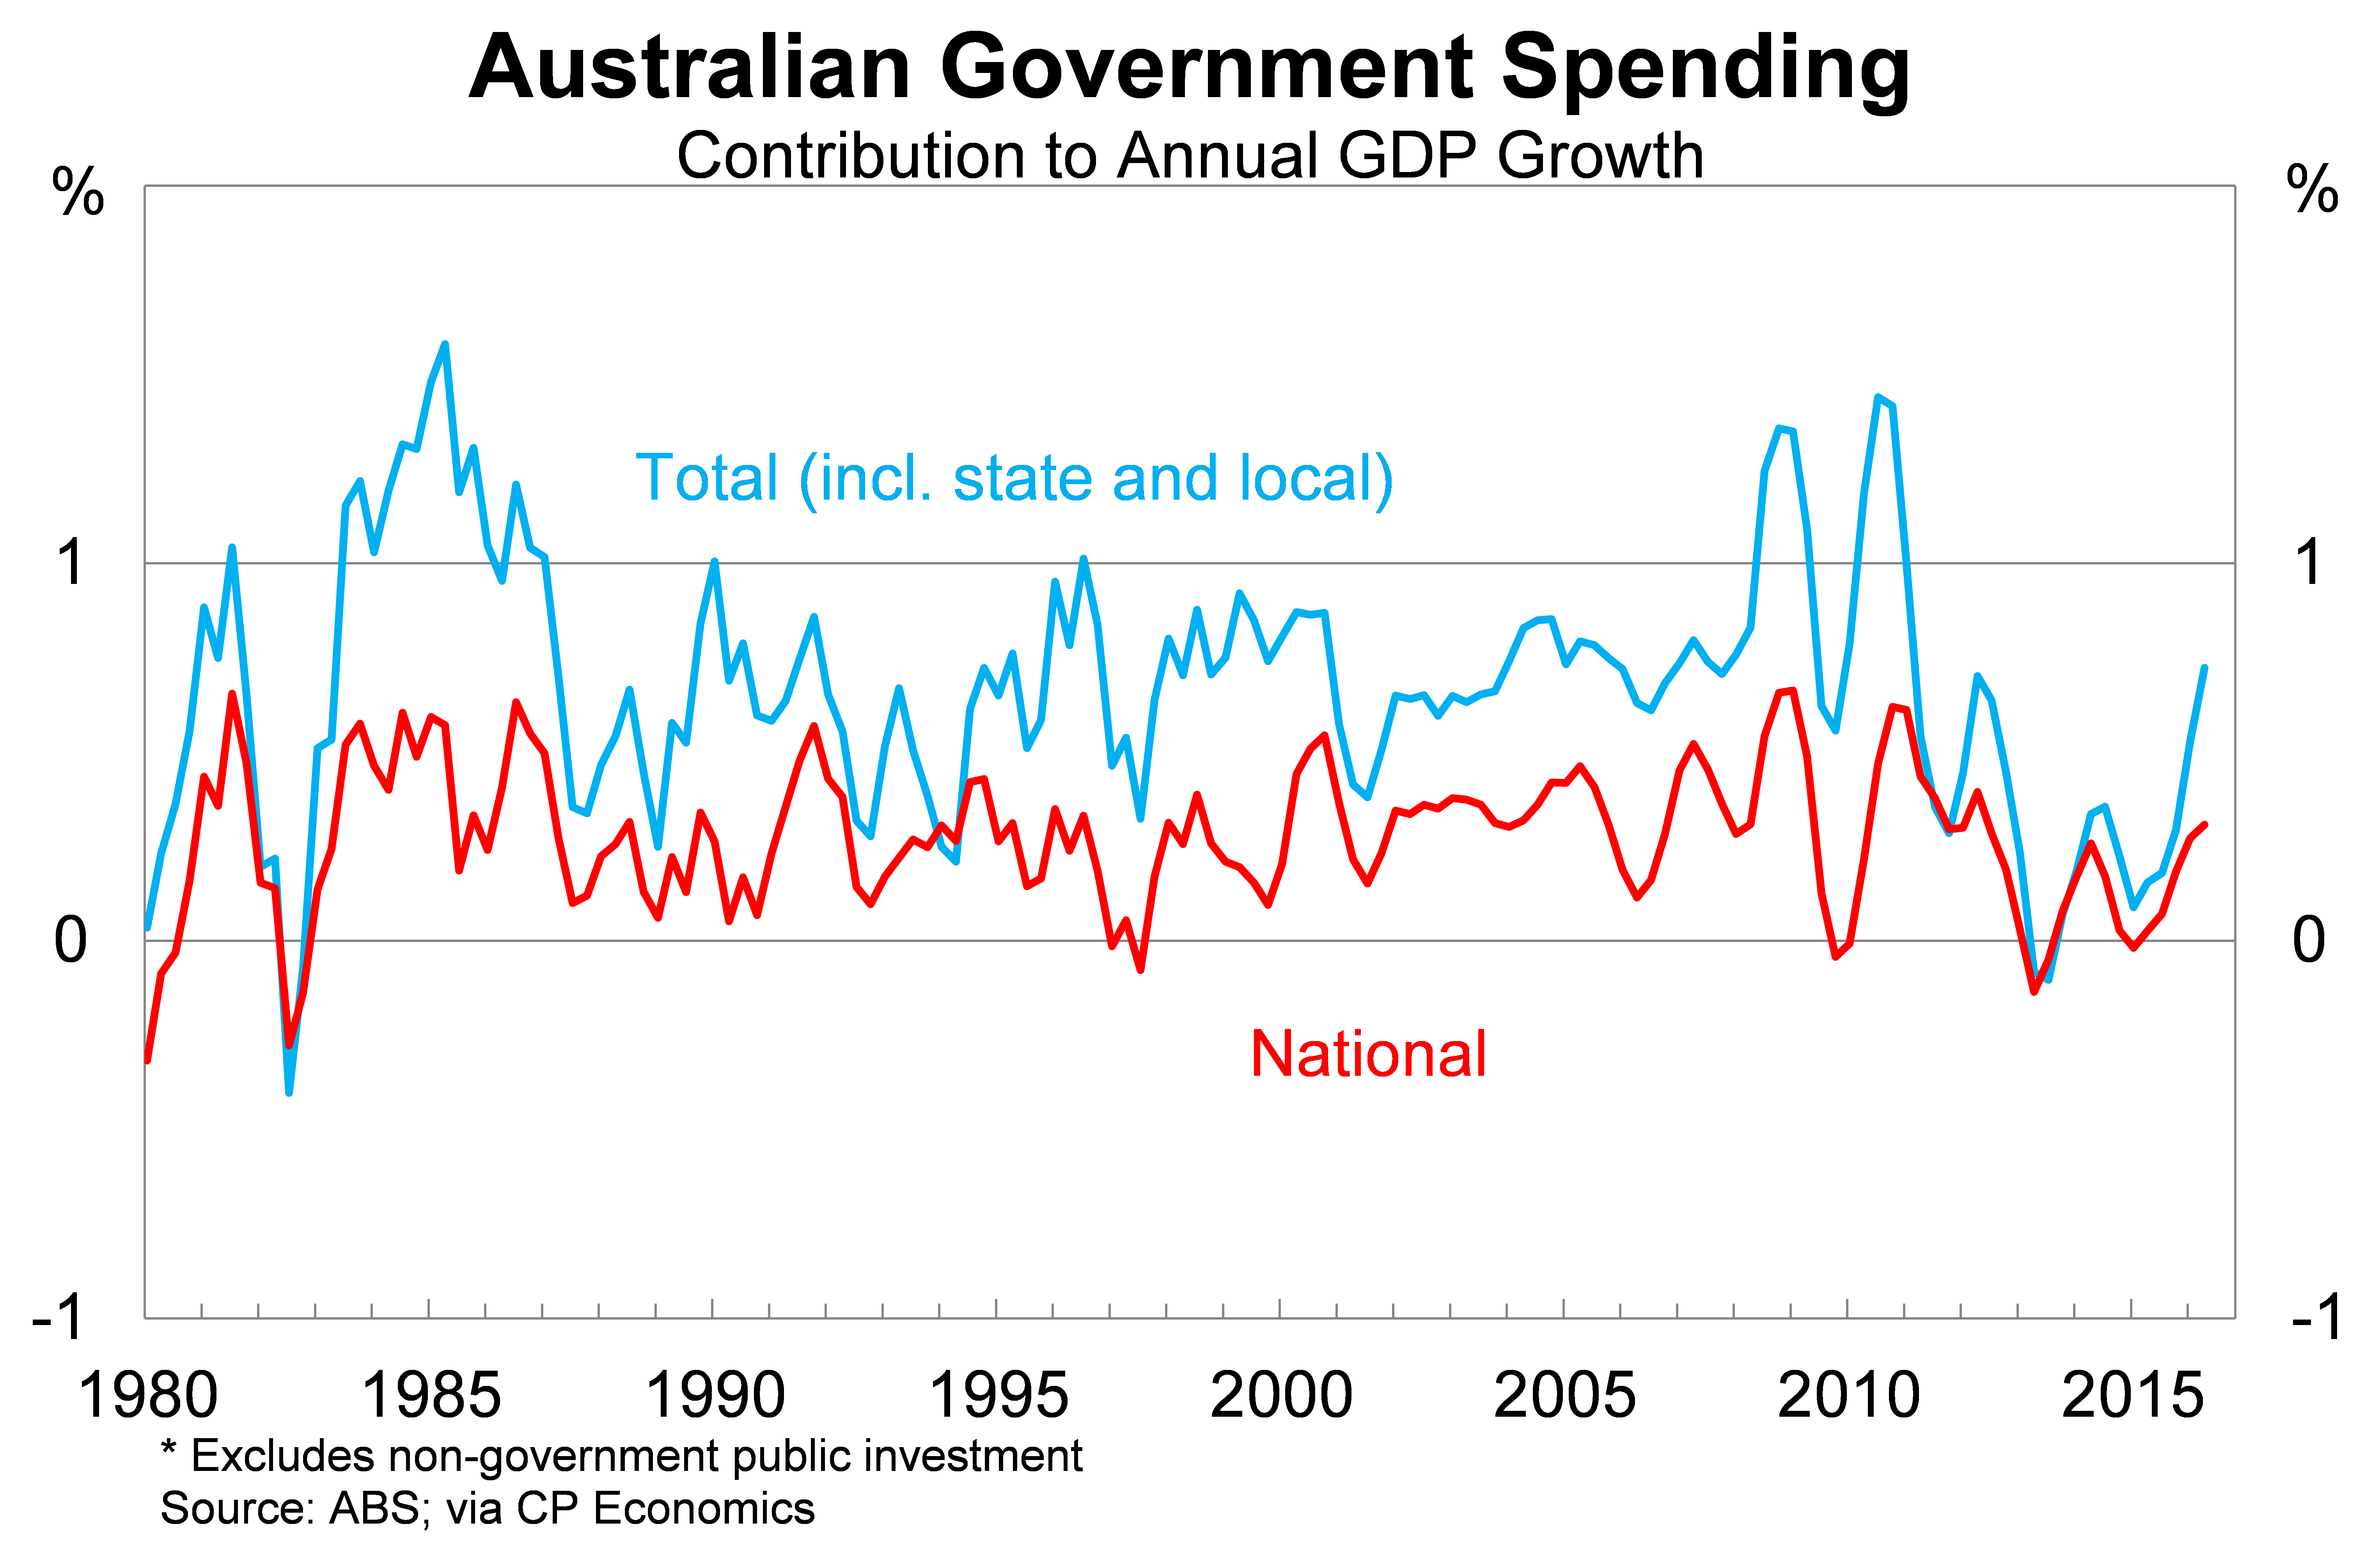
The surprise packet from a market perspective this quarter was the strong result coming from the public sector. Government spending rose by 4.5 per cent in the June quarter, well above market expectations, to be 6.3 per cent higher over the year.
To a large degree this reflected investment by state and local governments, although federal government investment also surged. A quarter such as this is often referred to as an outlier and I wouldn't be surprised if government investment fell next quarter.
The graph below shows the contribution to annual growth made by the various levels of government.
Some readers may be concerned about the budget implications of this result. Obviously spending remains quite high but it is concentrated in investment, which should provide an economic return across a number of years. Furthermore, tax revenue received a timely boost from the combination of higher commodity prices and stronger growth in nominal GDP (up 3.4 per cent over the year).
External
Net exports remains one of the more difficult components to assess. I noted earlier that net exports has been a major source of real GDP growth – accounting for over two-thirds of growth over the past year – but the income we have earned from those exports has declined.
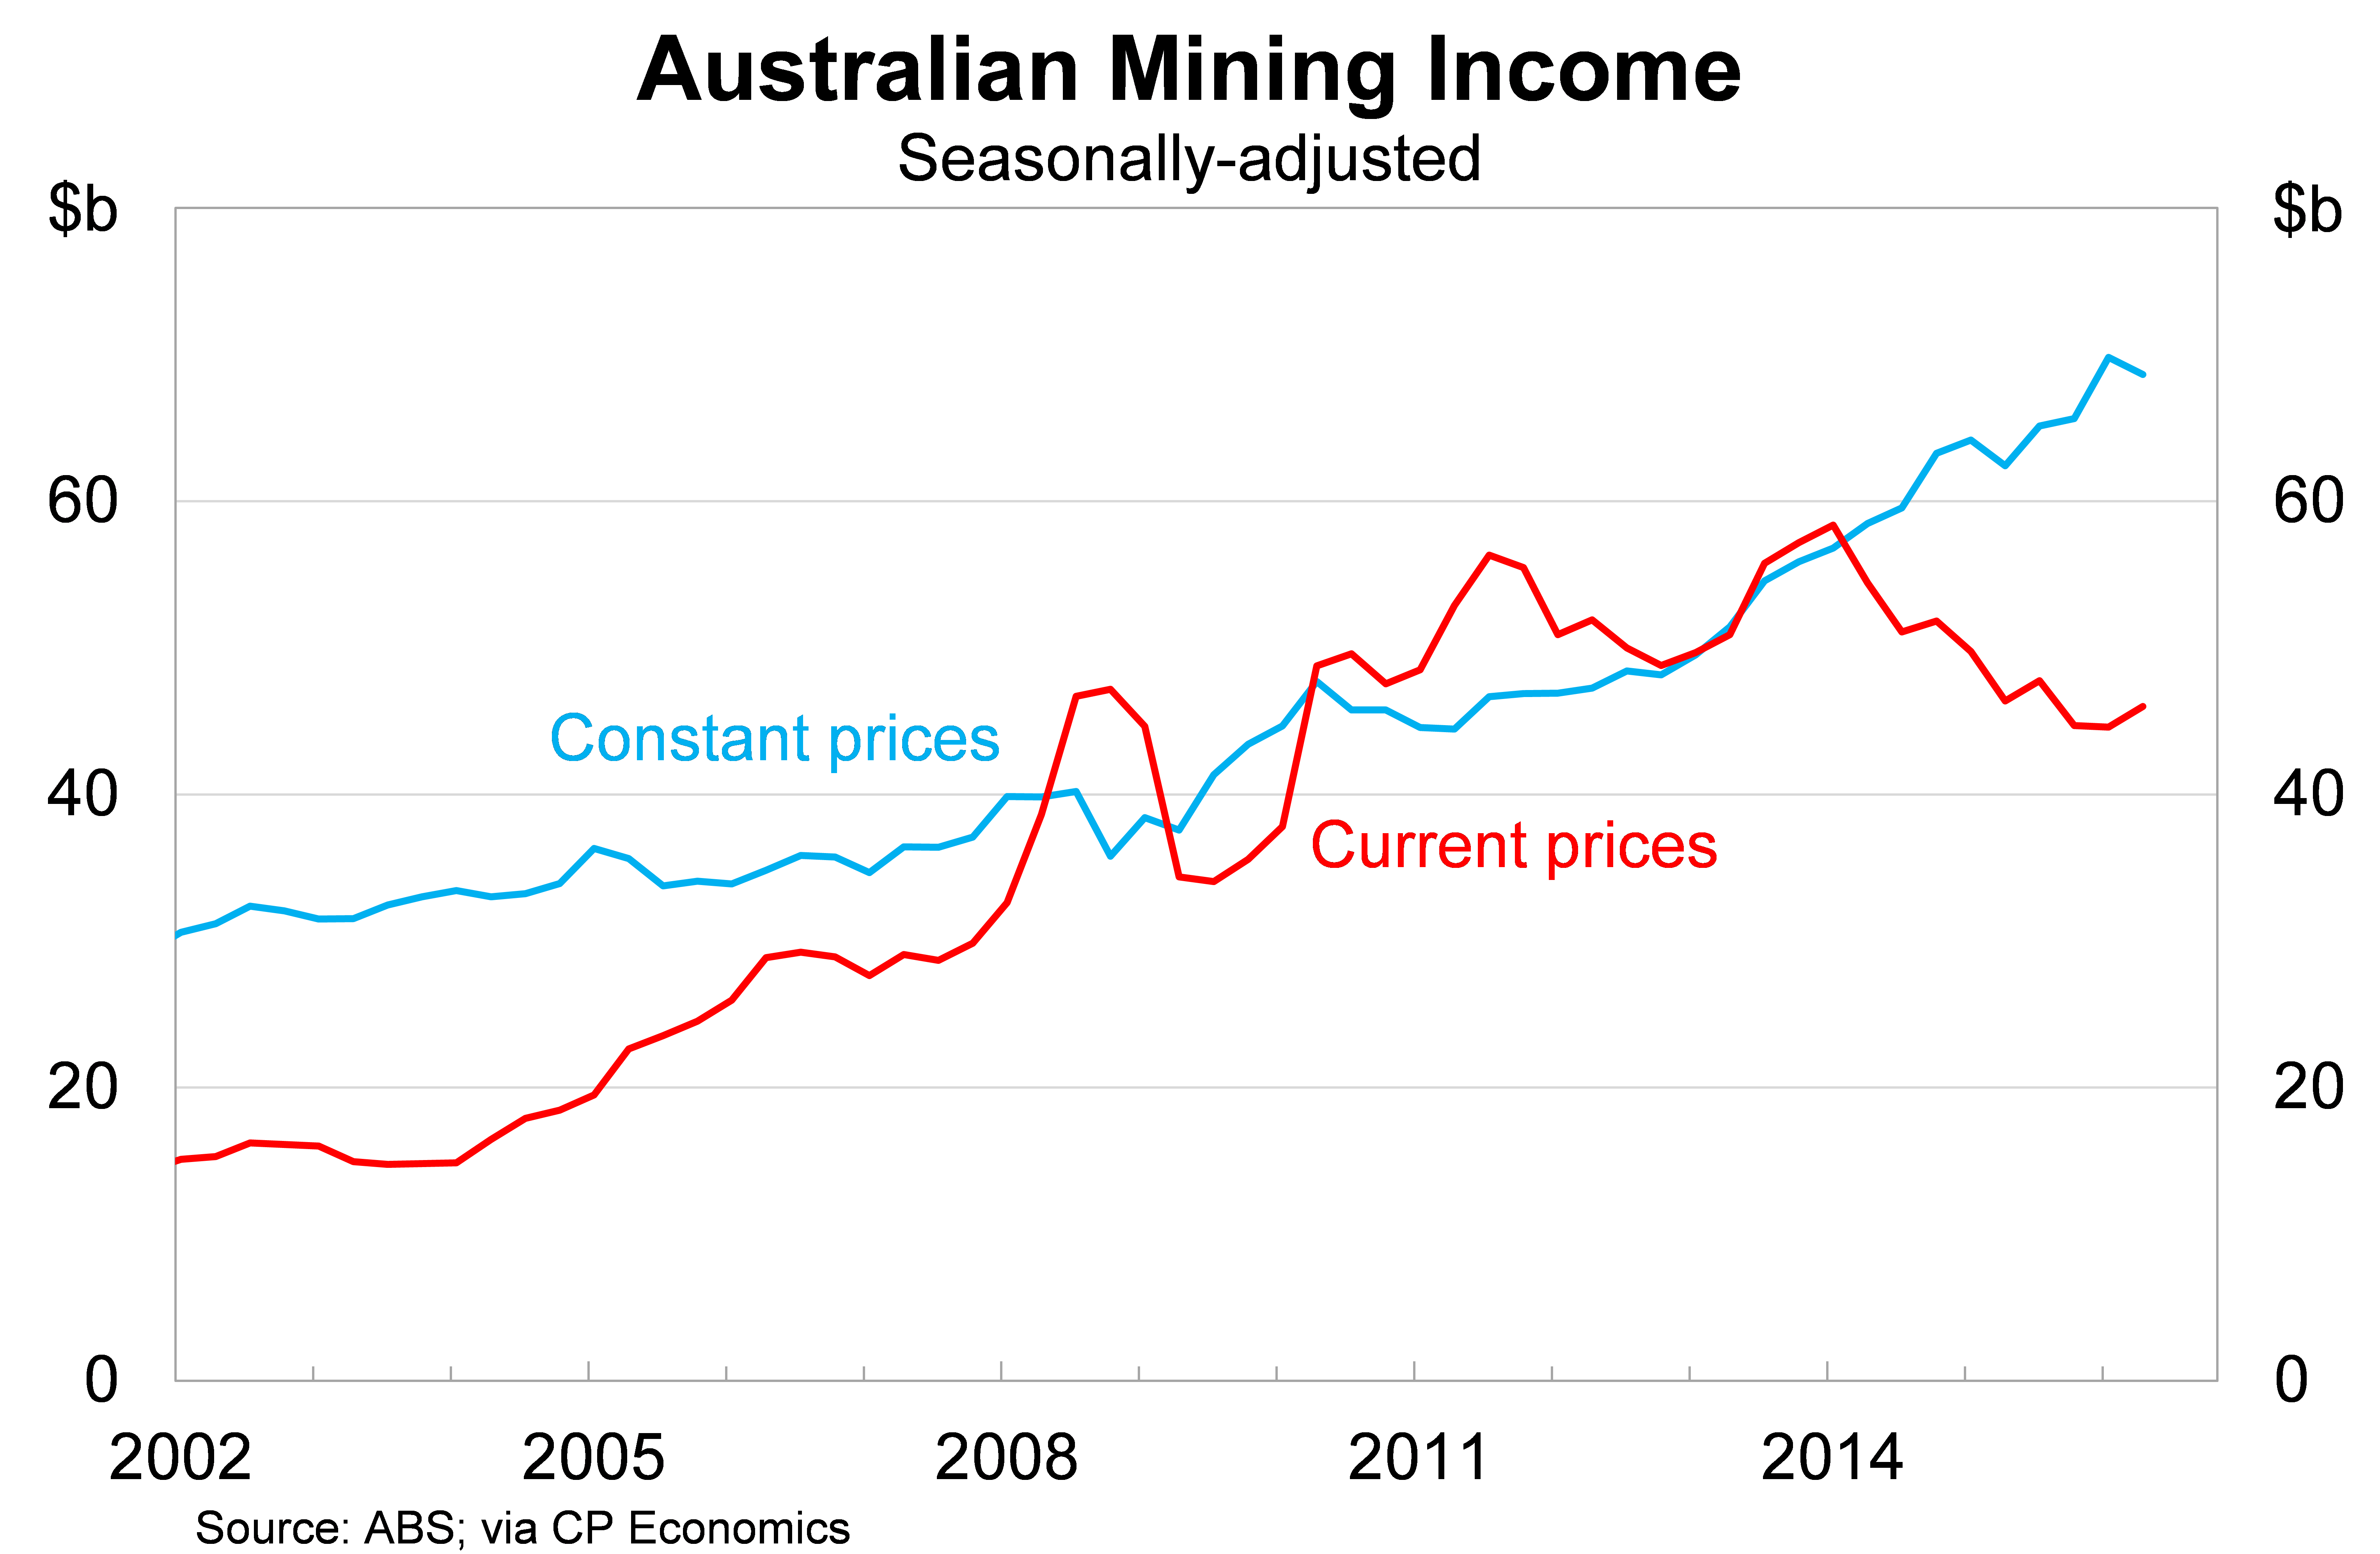
Net exports have contributed 2.2 percentage points to real GDP growth over the past year but has contributed just 0.9 percentage points to nominal GDP growth. The discrepancy between the two is significant and can perhaps best be illustrated by the graph below which compares the income earned by Australian miners against what their income would be if prices were constant.
Net exports is expected to be a key driver of the Australian economy throughout 2017 and 2018. Commodity prices though will determine whether Australian miners are a good investment or not. LNG exports are expected to be the next boom market and investors should watch closely to see how prices react as new supply comes online.


