MARKETS SPECTATOR: Rate cut relinquished
On first take, the market reacted very positively to this morning’s much better-than-expected employment numbers. Jobs creation of 71,500 versus expectations of 10,000 is a fairly sizable gap, and backing that up there was a significant upward revision to January’s number.
So far, so good, with the market jumping 0.2 per cent. However, it was to be very short lived as the sellers quickly took control, driving the market lower as the realisation dawned that the encouraging employment data meant the outlook for further rate cuts was dwindling fast.
Twelve-month interest rate expectations, as measured by the 12-month AUD Overnight Index Swap shot up from around the 2.86 per cent level to 2.96 per cent, which basically means that, right now there are no more interest rate cuts being priced into the market during the next 12 months.
While interesting, perhaps the more pertinent story is the move higher in the swap rate over the last two weeks, which corresponds to fewer rate cuts being priced into the market.
In the chart below, we can see that in mid-2012 the S&P/ASX 200 index and the 12-month swap rate moved higher together. However, since then that relationship seems to have broken down, as evidenced by the rectangles showing a rising swap rate coinciding with a pullback/consolidation in the benchmark equity index.

It makes pretty reasonable sense. With the economy running at two very different speeds (mining Australia vs East Coast), the record-low interest rates are in place to boost the East Coast economy enough so it can take up some of the slack from the slowing mining boom. 
Clearly, judging by the market’s reaction today, participants don’t believe the East Coast economy has benn, or can be, boosted enough given the current policy settings of 3 per cent.
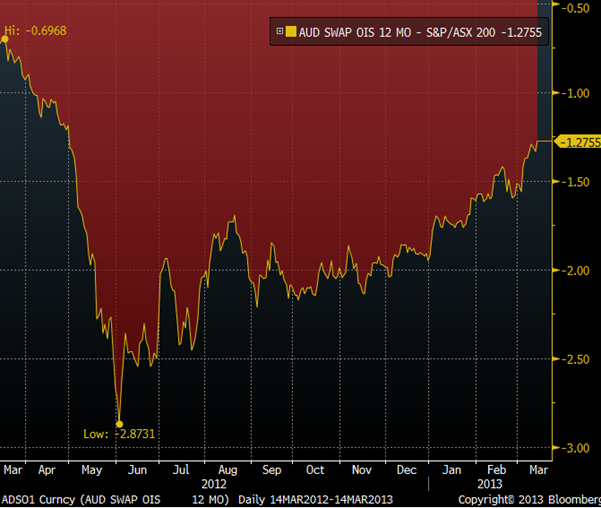
Interestingly, below is a chart of the spread between the 12-month OIS swap rate and the S&P/ASX 200 index dividend yield. Mid-last year, the spread between the index dividend yield and the 12-month swap rate was 2.87 per cent. However, with the rush into high-yielding stocks, which has driven the index yield down, the spread has now narrowed to only 1.27 per cent.
So while high yielding blue chips are still very sought after, especially when you take into account franking credits, you can see that the attractiveness is decreasing as the dividend yield has fallen and expectations of further rate cuts are dwindling.
We are nowhere near it yet but we will come to a point where the spread between the two is not attractive enough to offset the risk to capital of owning stocks.

As I warned a few weeks ago, it looks like we did see a false breakout to the upside, as you can see in the chart below. From here, I’d expect to see some support around the recent lows of 4975 – 5000. How much support is the million dollar question? From what we’ve seen, there’s no reason to think the money won’t be there to ‘buy the dips’, although there does seem to have been an easing in the number of participants willing to chase prices higher.


