Lomborg misleads on IPCC
Bjorn Lomborg had this to say about the information contained within IPCC’s Fifth Assessment report:
“The IPCC report is out. It is moderate – global warming is real, but not end-of-the-world … The report shows similar temperature rises to earlier reports, at about 1 to 3.7 degrees by the end of the century ... The IPCC’s moderate projections clearly contradict alarmist rhetoric, such as the recurring claims from activists of temperature rise of more than 5 degrees.”
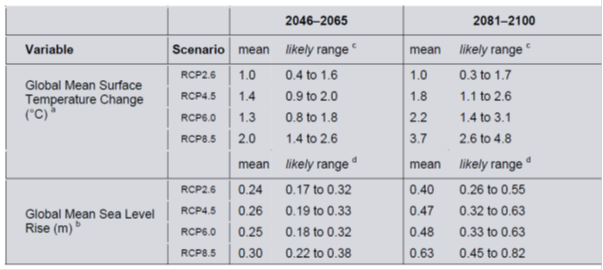
This is all very interesting. The lower bound of the temperature rises estimated by the IPCC, which Lomborg happily cites, are based upon scenarios where governments implement policies, which Lomborg argues against, to substantially constrain emissions. Meanwhile, the IPCC report suggests we run a very real risk of a 4 degree rise by this century and more than 5 degrees next century if we followed the advice of Lomborg’s favourite economics oracle, Richard Tol.
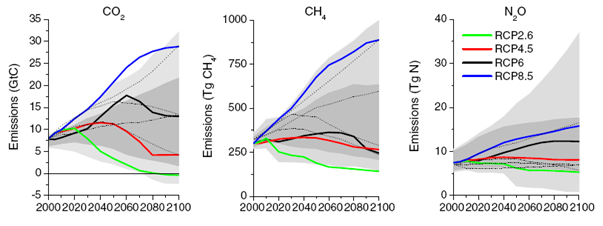
To explain further, in estimating likely future temperature rises the IPCC developed four scenarios for potential future levels of the emissions (called Representative Concentration Pathways, or RCP). These were entitled with numbers: 2.6; 4.5; 6.0; and 8.5. The chart below illustrates the annual emissions of the major greenhouse gases CO2, CH4 and N2O under each RCP out to 2100.
Figure 1: Annual greenhouse gas emissions under the four IPCC representative Concentration Pathways

Source: Skeptical Science Representative Concentration Pathways Guide.
As you can see RCP 2.6 (the green lines above) is one where governments suddenly get extremely serious about reducing emissions. Emissions start declining dramatically by 2020 and the concentration of CO2 equivalent is kept below 475ppm. If we were to keep emissions to the levels in RCP 2.6 it would be an incredible achievement in the face of resistance from Bjorn Lomborg and the legions of people that enthusiastically cite him.
RCP 8.5 involves emissions levels not all that much higher than the International Energy Agency expects based on current governments’ policies, as outlined in its 2012 World Energy Outlook (although in the IEA current policies scenario, emissions decline from 2070). So unless governments get their acts together we can expect something relatively similar to RCP 8.5.
The table below details the IPCC’s estimates of likely temperature change flowing from these scenarios for the time period 2046-2065 and 2081-2100 (relative to average temperatures of 1986 to 2005, not pre-industrial levels). It’s important to note that this is not the limit of temperature and sea level rises we’d see. Both would rise considerably further in the subsequent century, certainly under RCP 8.5 and 6.0. Indeed, there would be vastly more sea level rise after 2100.
Figure 2: IPCC projected temperature rises relative to 1986–2005 averages under different scenarios

Source: IPCC Fifth Assessment Report Physical Science - Summary for Policy Makers
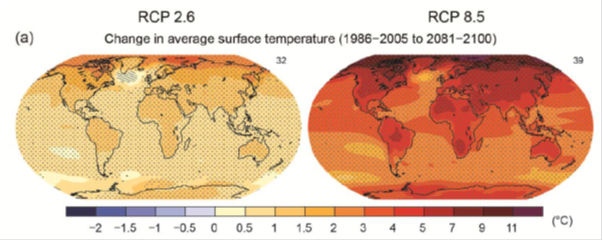
The picture below illustrates the likely geographical spread of temperature rise across the globe under RCP 2.6 and RCP 8.5. As you can see in the right hand globe, while the average global temperature rise is 3.7 degrees, land masses and the northern latitudes tend to experience higher rises, with severe consequences in terms of likely heatwave extremes.

Source: IPCC Fifth Assessment Report Physical Science - Summary for Policy Makers
If Lomborg was honest with people, he wouldn’t be citing results associated with either RCP 2.6 or 4.5 because they involve governments taking actions he recommends against doing.
The reality is that if government action to constrain emissions doesn’t get a whole lot more serious, we run very real risks of a 4 degree warmer world by 2100 (compared to pre-industrial levels), and whole lot worse after that.
The consequences are anything but moderate, and certainly worthy of alarm.


