June enviro markets update - STCs and LGCs
Small-scale Technology Certificates (STCs)
The lead-up to the business end of second quarter compliance in the STC market has been an eventful period, with initially strong spot market pricing followed by more mixed recent outcomes, some variability in STC submissions and an ongoing decline in the number of STCs in the clearing house queue.
The month of June in the STC market began with gradual increases in the spot, which ultimately culminated in the market reaching the long awaited $38.00 level in the middle of the month. Of particular highlight was the fact that despite the very large volumes which were transacted at $38.00, the market none-the-less managed to surpass this psychological level with activity recorded in the $38.00-$38.20 range for just over a week.
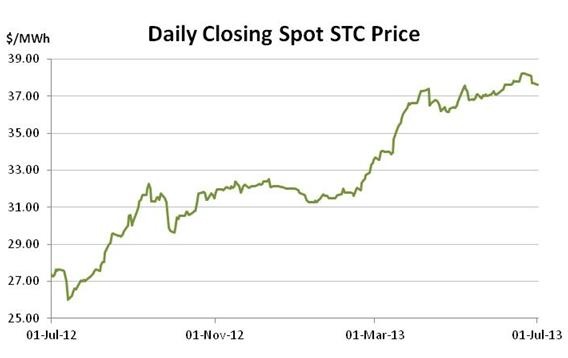
Yet rather than continuing to strengthen in the lead-up to the end of second quarter compliance (July 28), the market instead lost ground, falling to a three week low of $37.60 early in the new financial year. The softer outcome in recent days had been seen as a reflection of the fact that many liable entities had already met their targets for the second quarter. Wednesday saw the spot rally once again to reach the $38.00 mark, thus muddying the waters a little.
The recent drop in prices has however coincided with some movement on the other side of the supply/demand equation; i.e. an increase in the rate of STC submissions.
The chart below illustrates the full 2013 STC submissions history. Following a surprisingly soft conclusion to the month of May (352,000 submitted in the final week) submissions in June were generally higher. The Queen’s birthday public holiday impacted the second week of the month, yet strong numbers in recent weeks (including 505,000 last week) ensured the June’s average remained at 433,000.
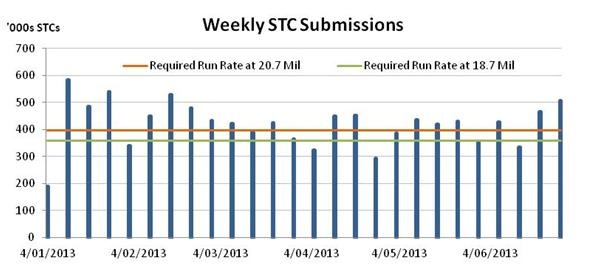
The recent strength in STC submissions appears to be a reflection of increased activity in Queensland as installers attempt to finish off the last of the state’s original 44 cent feed-in tariff eligible jobs. The increase had been expected by some to come sooner, yet given the delay between installation and STC submission, it may simply be the case that the submission numbers could remain stronger into July having been a little slower to get started across June.
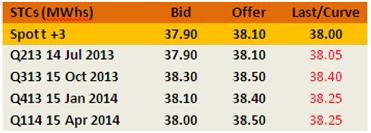
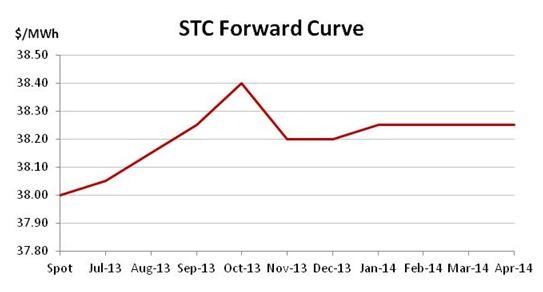
Looking to the forward market, recent times have seen the curve take some unusual shapes. In part a reflection of the limited upside ($40 max), which is the result of the Clearing House, buyers have been very reluctant to pay the curve beyond the short term in recent times.
The focus among buyers remains on the near term with something approximating a 4 per cent cost of carry having been paid for the current and sometimes following quarter. Across June this was manifest via a healthy rate of carry for deals settling in time for the second quarter compliance period, with a slightly reduced rate of carry for settlements across the third quarter.
Yet given the generally lofty levels reached once an escalation is applied to the $38 spot level (i.e. forwards in the mid $38s), there has been only modest interest in the fourth quarter and beyond, leading to the curve flattening or indeed occasionally dropping in the fourth quarter (see chart below).
2013 has still unquestionably been a fantastic year for sellers of STCs. The market is up 19.5 per cent since the start of the year and has not given up its recent gains unlike so many others.
One of the effects of the steady rally in the STC price has been a corresponding decline in the number of STCs in the Clearing House queue. Over recent years, with spot prices volatile yet generally significantly lower than the current levels, the Clearing House queue became a haven for those who were not prepared to sell their STCs at market rates.
Having sat around seven million across 2012, the number of STCs in the queue has gradually declined across the last 12 months, with a particularly rapid fall across the last six months. With a maximum of 5.5 million STCs in January, that number has now declined by 37 per cent to sit just shy of 3.5 million as the spot price reaches levels which are sufficiently high to entice sellers from the queue.
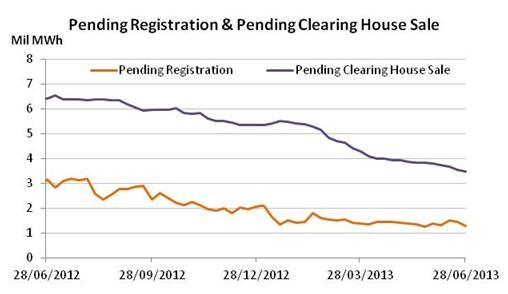
While it is likely this trend will continue across the year it is not necessarily the case that all sellers will withdraw from the Clearing House queue. For many of the smaller self creators (i.e. mums and dads) a $40 price is what they are waiting for. Such a scenario has some implications for the market as the number of STCs which remain in the queue will need to be compensated for via additional surplus STCs in order to prevent the Clearing House coming into play.
Large-scale Generation Certificate (LGCs)
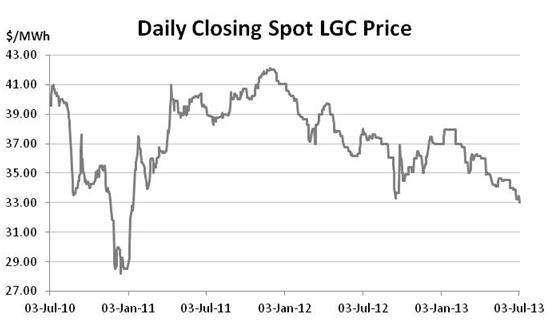
In the market for large-scale renewable energy, pricing outcomes were soft across June leaving the spot to close the financial year roughly 11 per cent below where the market opened in January. The recent falls have seen the LGC market surpass the lows briefly witnessed in 2012. And while the considerable political uncertainty which has contributed to the current pricing levels persists, options transactions have remained en vogue.
The LGC market has long been impacted by the regulatory uncertainty which comes with a scheme that relies on government policy to underpin demand in a political climate which has lacked bipartisan support of broad measures on the issue of climate change.
Aside from the ongoing LGC surplus which has meant there are plenty of available LGCs to meet demand over the short-term, the market remains subdued by the uncertainty which arises from the presence of a vocal minority within the Coalition ranks who is clearly intent on curtailing or removing the Renewable Energy Target althogether.
Despite the resurrection of Kevin Rudd, the Coalition remains odds-on favourite to take power at the coming election and hence there are concerns among many in the market that, at the very least, a Coalition government would accede to the push from certain groups within the energy sector to change the method for calculating the target from a fixed to a floating methodology.
In a market in which there are few with substantial interests in the short-term, this has resulted in a progressive softening in the spot. In June, following a brief reprieve across the latter part of May, the market fell through the $34 level for the first time since September 2012 on its way to settling in the low $33s.
As the chart below indicates, across the last three years there have been only three other brief instances when the spot market reached similar levels and in only one of those instances (Dec 2010-Jan 2011) did the market fall any lower.
Perhaps as a reflection of both the softness of the market as well as the ongoing regulatory uncertainty which is contributing to it, LGC options remained popular across the last month. Cal 14 and Cal 15 were the vintages most focused upon with both Puts and Calls featuring in healthy volumes across the month. Among the recent trades were several Cal 14 $30 strike Puts (the most recent of which transacted at $0.70) as well as a Cal 15 $41 strike Call (which traded at $1.35).
The popularity of these options reflect the fact that many participants are happy to pay the relatively modest upfront premiums for some protection against either falling (Puts) and rising (Calls) future markets.
The implied volatility of the majority of the options transactions have remained around the 12-13 per cent mark.
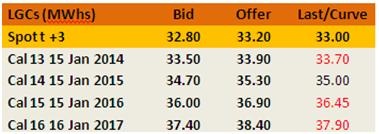
In terms of the forward market in the underlying, Cal 13s and Cal 14s were by far the standout focus. Most recently, following the additional softening in the spot price the Cal 14 traded at $35.00, a cost of carry just shy of 4 per cent.
Marco Stella is Senior Broker, Environmental Markets at TFS Green Australia. The TFS Green Australia team provides project and transactional environmental market brokerage and data services across all domestic and international renewable energy, energy efficiency and carbon markets.


