InvestSMART Portfolio Update - August 2017


Understanding our Risk Ratings
You may have noticed some changes to our Portfolio Risk Ratings recently.
The Standard Risk Measure (SRM) is a guide developed by the Financial Services Council (FSC) and The Association of Superannuation Funds of Australia (ASFA) that outlines the likely number of negative annual returns expected over any 20 year period.
The purpose of the SRM is to provide a standardised labelling system to assist investors in comparing investment options.
|
Risk Label |
Estimated number of negative annual returns over any 20 year period |
|
Very Low |
Less than 0.5 |
|
Low |
0.5 to less than 1 |
|
Low to Medium |
1 to less than 2 |
|
Medium |
2 to less than 3 |
|
Medium to High |
3 to less than 4 |
|
High |
4 to less than 6 |
|
Very High |
6 or greater |
Figure 1: FSC/ASFA Working Group Standard Risk Measure Classifications
Source: Financial Services Council & ASFA
We have reviewed our portfolios and adopted these risk rating guidelines, finding they are generally reflective of the standard risk versus reward continuum.
It should be noted however that the SRM is not a complete assessment of all forms of investment risk, for instance it does not detail what the size of a negative return could be or the potential for a positive return to be less than a member may require to meet their objectives. As such, it should be used as a guide and as with any investment, investors should ensure they are comfortable with the risks and potential losses associated with their chosen investment option(s).
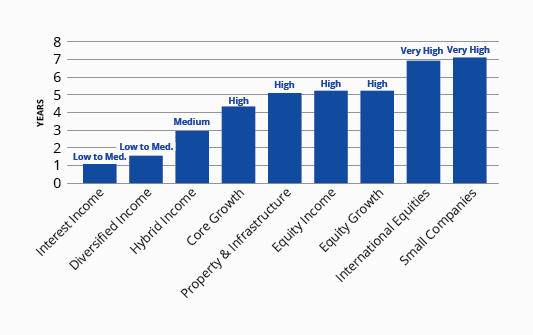
Figure 2: Estimated number of negative annual returns over 20 years
Source: MorningStar, InvestSMART
InvestSMART Interest Income Portfolio
The InvestSMART Interest Income Portfolio produced a return of 0.04% (after fees) during August.
The VanEck Vectors Australian Floating Rate ETF (FLOT) was the best performing security for the month up 0.24% while the Macquarie Income Opportunities Fund (MAQ0277AU) was worst performing at -0.08%.
The estimated yield on the portfolio is currently 2.30%.
Since inception, the portfolio has returned 2.16% per annum (after fees).
|
Performance to 31 August 2017 |
1 Month |
3 Months |
6 Months |
1 Year |
SI (p.a) |
|
InvestSMART Interest Income |
0.04% |
-0.18% |
1.17% |
0.04% |
2.16% |
|
Bloomberg AusBond Composite 0 Y TR AUD |
-0.01% |
-0.66% |
1.70% |
-0.66% |
3.20% |
|
Excess to Benchmark |
0.05% |
0.47% |
-0.53% |
0.70% |
-1.04% |
Figure 3: Portfolio Performance after fees
InvestSMART Core Growth Portfolio
The InvestSMART Core Growth Portfolio produced a return of 0.62% (after fees) during August.
Our recent addition in the VanEck Vectors Global Infrastructure ETF (IFRA) was the best performing security for the month up 2.79%, while the Macquarie Income Opportunities Fund (MAQ0277AU) was worst performing at -0.08%.
The estimated yield on the portfolio is currently 2.90%.
Since inception, the portfolio has returned 7.00% per annum (after fees).
|
Performance to 31 August 2017 |
1 Month |
3 Months |
6 Months |
1 Year |
2 Years |
SI (p.a) |
|
InvestSMART Core Growth |
0.62% |
-1.01% |
3.03% |
6.41% |
5.80% |
7.00% |
|
Morningstar Aus Msec Growth TR AUD |
0.66% |
-0.84% |
2.62% |
5.56% |
6.14% |
7.63% |
|
Excess to Benchmark |
-0.03% |
-0.17% |
0.41% |
0.85% |
-0.35% |
-0.62% |
|
RBA Cash Rate 3% |
0.37% |
1.13% |
2.27% |
4.59% |
4.80% |
4.97% |
|
Excess to Objective |
0.25% |
-2.14% |
0.76% |
1.82% |
1.00% |
2.03% |
Figure 4: Portfolio Performance after fees
InvestSMART Diversified Income Portfolio
The InvestSMART Diversified Income Portfolio produced a return of 0.20% (after fees) during August.
The Vanguard Australian Property Securities Index ETF (VAP) was the best performing security for the month up 0.81% while the Macquarie Income Opportunities Fund (MAQ0277AU) was worst performing at -0.08%.
The estimated yield on the portfolio is currently 3.27%.
Since inception, the portfolio has returned 4.10% per annum (after fees).
|
Performance to 31 August 2017 |
1 Month |
3 Months |
6 Months |
1 Year |
2 Years |
SI (p.a) |
|
InvestSMART Diversified Income |
0.20% |
-0.25% |
1.20% |
1.85% |
4.55% |
4.10% |
|
Morningstar Aus Msec Moderate TR AUD |
0.44% |
-0.29% |
1.99% |
2.47% |
4.41% |
4.58% |
|
Excess to Benchmark |
-0.24% |
0.04% |
-0.79% |
-0.62% |
0.15% |
-0.48% |
|
RBA Cash Rate 1% |
0.21% |
0.63% |
1.26% |
2.53% |
2.73% |
2.85% |
|
Excess to Objective |
-0.01% |
-0.88% |
-0.06% |
-0.68% |
1.82% |
1.25% |
Figure 5: Portfolio Performance after fees
InvestSMART Diversified Property & Infrastructure Portfolio
The InvestSMART Diversified Property & Infrastructure Portfolio produced a return of 0.18% (after fees) during August.
Stockland (SGP) was the best performing security for the month up 5.57% while Vicinity (VCX) was worst performing at -4.64%.
In the interests of providing a more diversified property solution to investors, we expanded the mandate of this fund during the month to include global property and infrastructure exposures. To do this, we added two ETFs, the SPDR Dow Jones Global Real Estate Fund (DJRE) & VanEck Vectors FTSE Global Infrastructure ETF (IFRA)
The estimated yield on the portfolio is currently 3.18%.
Since inception, the portfolio has returned 4.36% per annum (after fees).
|
Performance to 31 August 2017 |
1 Month |
3 Months |
6 Months |
1 Year |
SI (p.a) |
|
InvestSMART Diversified Property & Infrastructure |
0.18% |
-4.83% |
-3.35% |
-9.93% |
4.36% |
|
A Composite Index |
1.28% |
-3.67% |
-1.63% |
-7.43% |
6.69% |
|
Excess to Benchmark |
-1.10% |
-1.16% |
-1.72% |
-2.50% |
-2.33% |
Figure 6: Portfolio Performance after fees
InvestSMART International Equities Portfolio
The InvestSMART International Equities Portfolio produced a return of 0.88% (after fees) during August.
The iShares Asia 50 ETF (IAA) was the best performing security for the month up 1.70%.
The estimated yield on the portfolio is currently 1.94%.
Since inception, the portfolio has returned 9.94% per annum (after fees).
|
Performance to 31 August 2017 |
1 Month |
3 Months |
6 Months |
1 Year |
2 Years |
SI (p.a) |
|
InvestSMART International Equities |
0.88% |
-3.23% |
4.72% |
9.04% |
4.96% |
9.94% |
|
MSCI World Ex Australia NR AUD |
0.81% |
-3.49% |
4.58% |
10.07% |
5.16% |
12.08% |
|
Excess to Benchmark |
0.07% |
0.26% |
0.14% |
-1.02% |
-0.20% |
-2.14% |
Figure 7: Portfolio Performance after fees
InvestSMART Hybrid Income Portfolio
The InvestSMART Hybrid Income Portfolio produced a return of 0.20% (after fees) during August.
Macquarie Income Securities (MBLHB) was the best performing security for the month up 1.95% while National Income Securities (NABHA) was worst performing at -0.81%.
During the month we removed CTXHA from the portfolio & reduced exposure to WBCPF, NABPB and NABPC. We increased our holdings in ANZPD, ANZPF and CBAPD and have maintained a higher cash allocation than the previous month.
The estimated Gross Running Yield (incl. of franking) is currently 5.1% while the Yield to Maturity (incl. of franking) is 5.0%.
Since inception, the portfolio has returned 0.30% per annum (after fees).
|
Performance to 31 August 2017 |
1 Month |
SI (p.a) |
|
InvestSMART Hybrid Income |
0.20% |
0.30% |
|
RBA Cash Rate 3% |
0.37% |
0.75% |
|
Excess to Benchmark |
-0.18% |
-0.45% |
Figure 8: Portfolio Performance after fees


Frequently Asked Questions about this Article…
The Standard Risk Measure (SRM) is a guide developed by the Financial Services Council and the Association of Superannuation Funds of Australia. It outlines the likely number of negative annual returns expected over any 20-year period. This standardized labelling system helps investors compare investment options by providing a clear understanding of potential risks.
Investors should use the Standard Risk Measure as a guide to understand the potential frequency of negative returns over a 20-year period. However, it's important to note that the SRM doesn't account for the size of negative returns or whether positive returns meet investment objectives. Therefore, investors should ensure they are comfortable with the risks and potential losses associated with their chosen investment options.
In August 2017, the InvestSMART Interest Income Portfolio produced a return of 0.04% after fees. The best performing security was the VanEck Vectors Australian Floating Rate ETF, which was up 0.24%, while the Macquarie Income Opportunities Fund was the worst performer at -0.08%.
The InvestSMART Core Growth Portfolio achieved a return of 0.62% after fees in August 2017. The VanEck Vectors Global Infrastructure ETF was the best performing security, rising by 2.79%, whereas the Macquarie Income Opportunities Fund was the worst performer at -0.08%.
In August 2017, the InvestSMART Diversified Property & Infrastructure Portfolio expanded its mandate to include global property and infrastructure exposures. This was achieved by adding two ETFs: the SPDR Dow Jones Global Real Estate Fund and the VanEck Vectors FTSE Global Infrastructure ETF.
The estimated yield of the InvestSMART International Equities Portfolio is currently 1.94%. Since its inception, the portfolio has returned 9.94% per annum after fees.
The InvestSMART Hybrid Income Portfolio produced a return of 0.20% after fees in August 2017. Macquarie Income Securities was the best performing security, up 1.95%, while National Income Securities was the worst performer at -0.81%.
The current estimated Gross Running Yield for the InvestSMART Hybrid Income Portfolio, including franking, is 5.1%, while the Yield to Maturity, also including franking, is 5.0%.


