InvestSMART Australian Exchange-Traded Fund Quarterly Report - June 2018


About this report
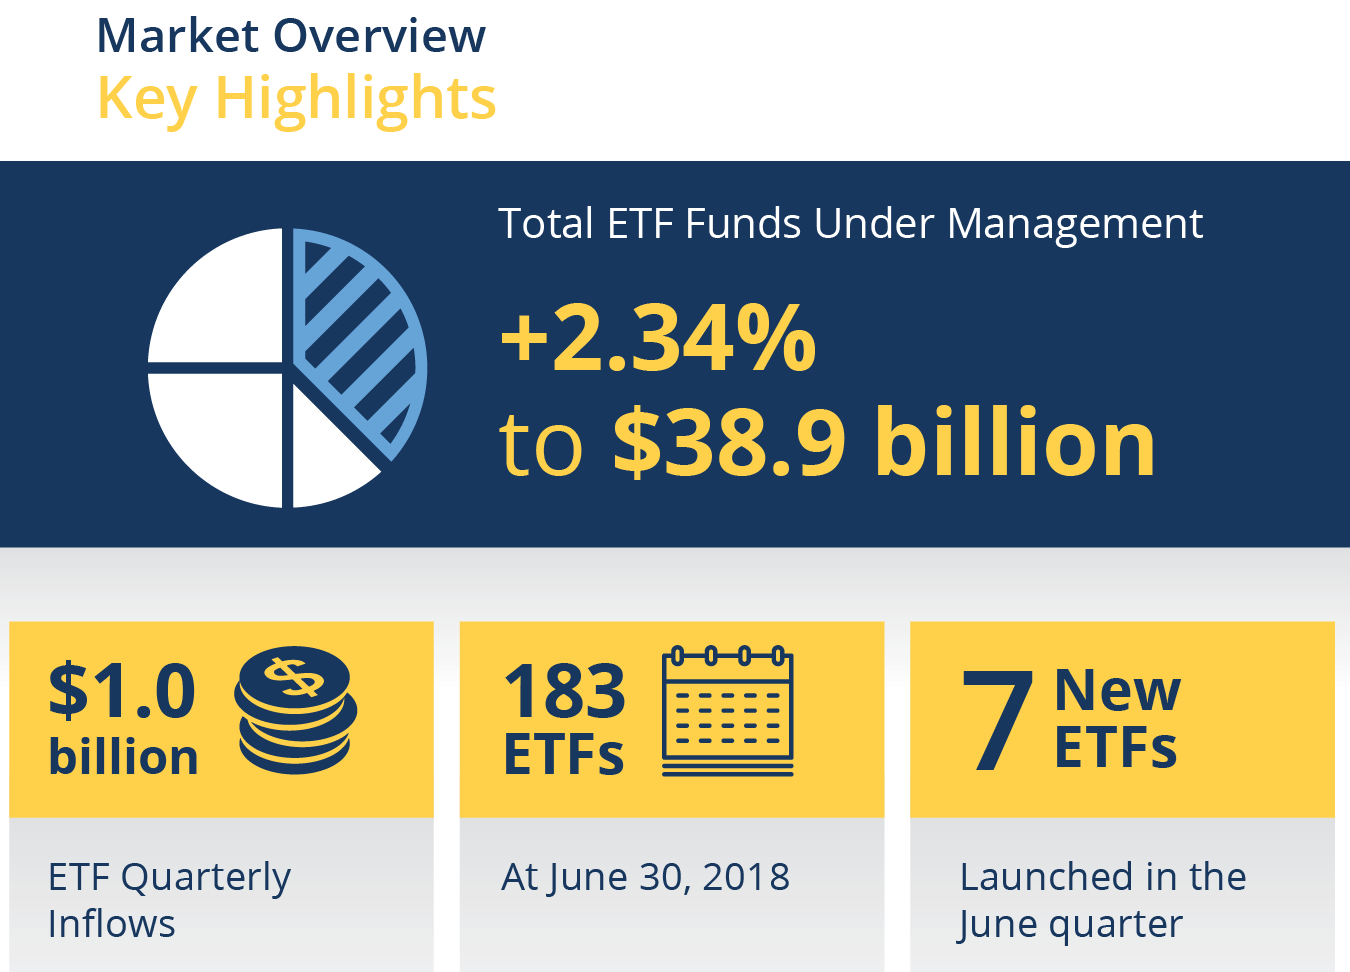
Highlights
Market Overview
Securities Overview
About this report
Welcome to InvestSMART’s June Quarter 2018 Australian Exchange-Traded Products (ETP) update.
Exchange Traded Funds (ETFs) form the basis of a range of InvestSMART’s Separately Managed Account (SMA) portfolios. The purpose of this report is to provide our clients with an easy to digest wrap of market activity as well as provide a greater level of insight into how and why we’ve built our SMA portfolios the way we have.
ETFs are a low-cost, hassle-free way for investors to achieve their investment objectives. Whether your aim is to diversify your portfolio or to obtain exposure to a particular investment theme, the ability to buy ETFs directly on market, their low cost and transparency has seen the popularity of these securities amongst investors grow rapidly.
We have categorised the ETP market by asset class to allow members to quickly identify suitable securities to fill any investment gaps in their portfolio and remain aligned to their specific investment objectives.
Figure 1: Asset Classes
| Asset Class | Description |
|---|---|
| Commodities | Exchange Traded Products (ETPs) that provide exposure to various Commodities & Natural Resources. |
| Currency | Exchange Traded Products (ETPs) that provide exposure to various Currencies. |
| Diversified | Exchange Traded Products (ETPs) that provide Diversified Multi Sector exposure |
| Equities | Exchange Traded Products (ETPs) that provide exposure to Equity Markets. |
| Fixed Income & Cash | Exchange Traded Products (ETPs) that provide exposure to Interest Rate securities and Cash. |
| Property & Infrastructure | Exchange Traded Products (ETPs) that provide exposure to Domestic and Global Property and Infrastructure. |
About InvestSMART
Founded in 1999, InvestSMART Group Limited (ASX:INV) believes everyone should have the confidence to control their financial future and it shouldn’t be hard or expensive to do so.
Whether you’re managing your own investments or looking for a little help, we deliver straightforward, flexible and affordable solutions to ensure you are better able to meet your investment goals.
Our three leading brands – InvestSMART, Eureka Report and Intelligent Investor – together offer actionable investment tools, wealth advice and independent ASX-listed stock research.
We’re all about making investing simple. Statistics show four in five Australians do not receive any professional investment advice, with cost the primary reason. We aim to change that.
Through our Portfolio Manager, stock research, wealth commentary and affordable investment products, we believe we are delivering the right tools to help all Australians grow and protect their wealth.
InvestSMART Star Rating
When reviewing an ETF there are some key quantifiable metrics common to every security.
To save time in reviewing each and every ETF listed on the Australian Market, we have developed a Quantitative 5 Star Rating System that takes each of these items into account. It is reflective of the process we use to identify investments for our own SMA portfolios.
Figure 2: InvestSMART Star Rating Criteria
| Factor | Description |
|---|---|
| Size | Funds under management. |
| Fees | Fund management fees as a percentage of FUM. |
| Liquidity | Trading volumes. |
| Spread | The average percentage difference between the bid & ask. |
| Tracking error | The difference in the return profile of the Fund to its benchmark. |
For our portfolios, we generally like to see a 4 to 5-star rating, as this implies the security rates well across each of the above-mentioned metrics. However, the star rating is best used as a filtering tool when comparing ETFs with the same objective. It does not make sense to compare a highly liquid, and hence low-cost S&P500 ETF to one designed to track the performance of emerging markets which are often less liquid and more expensive to access.
It should also be noted that the InvestSMART Star Rating is a quantitative measure and it does not take one’s investment objectives into account. The InvestSMART Star ratings do not constitute recommendations. Additionally, we do not rate Actively Managed Funds or Structured products, and this is denoted by an NR or “Not Rated”.
Figure 3: Number of ETFs per star rating
| Star Rating | Number of ETFs |
|---|---|
 5 5 |
7 |
| 4 |
31 |
| 3 |
58 |
| 2 |
42 |
| 1 |
4 |
| NA | 34 |
Highlights this Quarter
InvestSMART launches its first active ETF - Australian Equity Income Fund (ASX:INIF)
During the month of June, we listed our very own listed managed fund, or active ETF. The InvestSMART Australian Equity Income Fund (ASX: INIF) is based on the same portfolio we have managed under the Separately Managed Account (SMA) structure for the past 3 years.
The primary objectives of the Fund are to achieve attractive risk-adjusted returns over the medium to long-term while reducing the risk of permanent capital loss. Investors get exposure to active management of a concentrated portfolio of well-researched Australian equities with a sustainable high yield.
You can view the most up to date fund information here.
How does the fund select investments?
The investment approach is buying and holding shares with market prices at material discounts to their estimated value and high sustainable yields. Investments will be sold if they move to a material premium to their estimated value, or the dividend yield is expected to fall.
Key Features
Figure 4: Key Features
|
ASX Code |
INIF |
|
Fund Manager |
InvestSMART |
|
Registry |
Registry Direct |
|
Distribution Frequency |
Semi-Annual (Ex-date June & December) |
|
Is DRP available |
Yes |
|
Portfolio Dividend Yield (net)^ |
3.8% |
|
Portfolio Dividend Yield (gross)^ |
4.8% |
|
Management Fee^ |
0.97% (Incl GST) |
|
Average Spread* |
46bp |
|
Suggested investment timeframe |
5 years |
|
Number of Stocks |
10-35 |
^As at 30 June 2018. *Per ASX investment products monthly update, June 2018
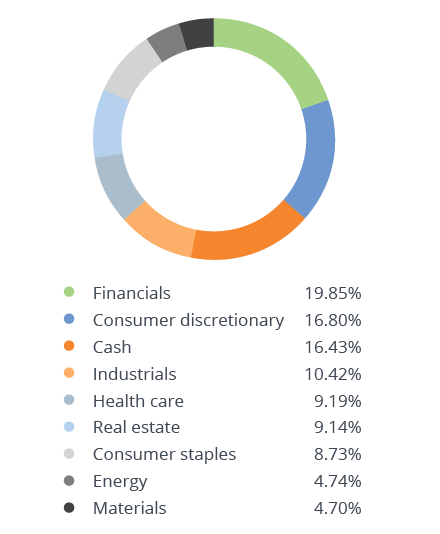
Portfolio Characteristics
|
Figure 5: Asset Allocation |
Figure 6: Top 10 | |
|
|
Top 10 |
|
|
Code |
Weight |
|
|
TME |
6.61% |
|
|
SEK |
5.11% |
|
|
ASX |
4.88% |
|
|
WES |
4.80% |
|
|
WPL |
4.74% |
|
|
BHP |
4.70% |
|
|
CBA |
4.64% |
|
|
SCG |
4.62% |
|
|
LEP |
4.52% |
|
|
SYD |
4.32% |
|
As at 30 June 2018
Performance – Historical
INIF is based on the same portfolio we have managed under the Separately Managed Account (SMA) structure for the past 3 years, the performance of which is noted below.
Figure 7: Intelligent Investor Equity Income - Performance to 30 June 2018
|
Performance to 30 June 2018 |
1 Month |
3 Month |
6 Month |
1 Year |
2 Year (p.a) |
3 Year (p,a) |
S.I (p.a) |
|
Intelligent Investor Equity Income |
3.00% |
6.34% |
2.41% |
8.57% |
12.97% |
12.36% |
12.36% |
FAQs
What is an iNAV
iNAV stands for Indicative Net Asset Value. The Net Asset Value (NAV) is calculated by deducting all liabilities (including fees) from the total value of the Fund’s assets and dividing this number by the number of Units on issue.
During each ASX Trading Day, an indicative NAV (iNAV) is published to take into account any movement of the prices of those securities that comprise the Fund's investment portfolio. This is unlike a traditional unlisted fund, which will only provide a unit price once daily. We publish our iNAV and a history of the day end NAV here.
When will the distribution be paid and what is it made up of?
The distribution will be twice a year after the end of financial year and calendar year. The distribution is made up of all income received by the Fund. This includes dividends paid, interest earned on cash and realised capital gains.
Do I receive a tax statement?Yes. At the end of financial year you will be issued a tax statement. The timing of the issuing of the tax statement may vary depending on the holdings of the Fund. If, for instance, the Fund invests in any listed trusts such as real estate investment trusts (REITs), the Fund will need to wait until the REITs issue an annual report before the Fund can complete the tax statements.
You can find the full list of frequently asked questions on our website.
What is the difference between ETFs, Active ETFs, LICs & mFunds?
When the first ETFs were listed they were quite simple products. They were designed to track well known, broad based equity indices, for example the S&P ASX200. However, with the advent of actively managed and Smart Beta ETFs in recent years, the lines between the traditionally passive ETF and the actively managed unlisted funds and LICs have started to blur, confusing some investors.
Exchange Traded Funds (ETF)
An ETF is a passive fund that seeks to replicate or track the performance of an index, specified combination of multiple indices, or other widely regarded benchmark, the value of which is continuously disclosed, or can be immediately determined.
Active ETF or Exchange Traded/Quoted Managed Funds (ETMF/EQMF)
An Active ETF or EQMF/ETMF is one that buy or sells investments based on an active investment strategy or where they seek to outperform a particular benchmark. Due to being actively managed, they often charge higher fees than passive ETFs. We wrote about the differences between active and passive ETFs in last quarters ETF report.
InvestSMART launched its first active ETF (listed fund) June 2018. Trading under ticker code: INIF, the listed fund mirrors the group’s existing unlisted Intelligent Investor Equity Income Portfolio which is desisgned to deliver investors exposure to a concentrated portfolio of up to 30 Australian equities with a sustainable income and around , actively managed by a team that has a research track record of more than 20 years.
You can find our ETF filtering tool here.
Listed Investment Companies (LIC)
Like ETFs, a LIC is simply a portfolio of assets managed by a professional fund manager. However, they differ in that they are closed ended and incorporated as companies as opposed to trusts. As LICs are companies, they have the option to retain or pay dividends.
You can find our LIC filtering tool here.
mFunds (mFund)
An mFund product is simply an unlisted managed fund that is available to investors via the ASX. The service allows investors to buy/sell units in a range of funds in the same way as they do for ordinary shares, removing the need to fill out forms each time you wish to transact.
Figure 8: Difference between Fund Types
|
|
ETF |
EQMF/Active ETF |
LIC |
mFund |
|
Active/passive |
Passive |
Active |
Active |
Active |
|
Legal structure |
Unit Trust |
Unit Trust |
Company |
Unit Trust |
|
Tax rate |
Marginal tax rate |
Marginal tax rate |
Company tax rate |
Marginal tax rate |
|
Can trade at disc/prem |
No |
No |
Yes |
No |
|
Liquidity |
High |
High |
Variable |
Variable |
|
Transparency of holdings |
Daily |
Variable |
Monthly |
Variable |
|
Open/closed ended |
Open |
Open |
Closed |
Open |

Funds Under Management
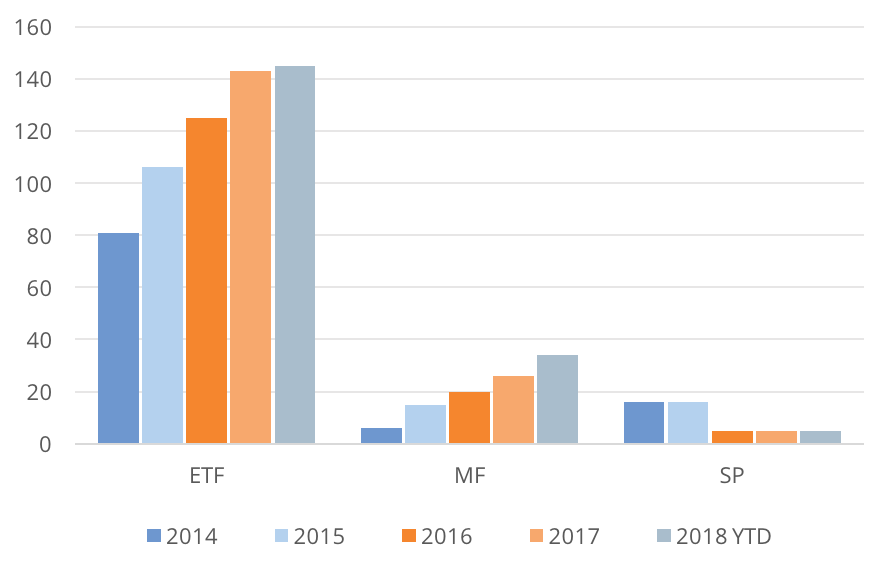
The Australian ETP market grew 7.5% during the June Qtr to close just shy of $40bn at 30 June. During the quarter there were 7 new products listed to take the total up to 183. There were also two new issuers to market with eInvest (EIGA) and InvestSMART (INIF) launching a fund each.
It is interesting to note that of the 10 new funds listed in the last 6 months, 8 of which are considered “Managed Funds” (MF). We expect to see, more MF structured listings as technology becomes available to smaller issuers, making it possible for them to list their products on market. We’ve had positive feedback from our own clients who appreciate the relative low cost and ease at which they can access these funds. As the ETF market matures, we also expect to see more factor based/themed funds.
Figure 9: Market Growth
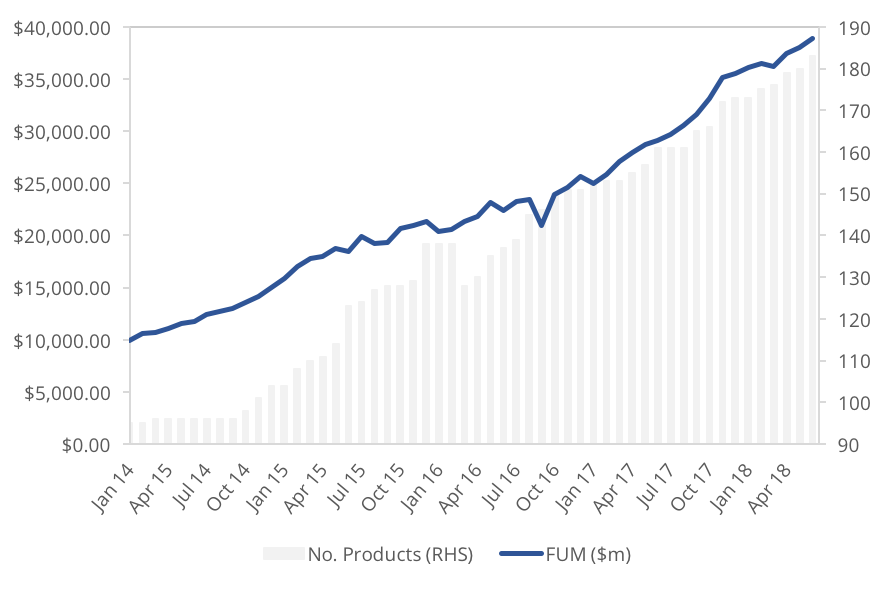
Figure 10: FUM Growth - Inflows vs Performance
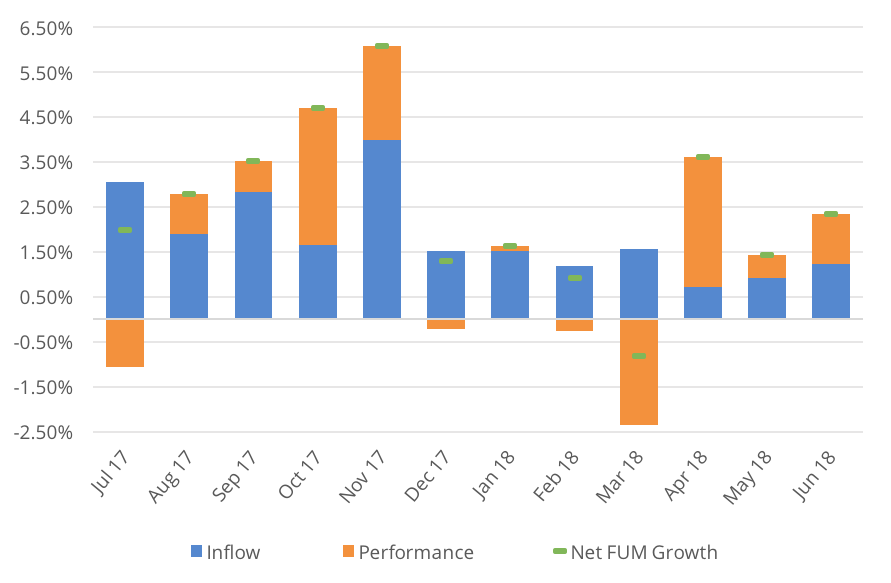
Figure 11: ETP Market Breakdown by Issuer
| Issuer | No. Products (Mar) |
No. Products (Jun) |
FUM $m (Mar) |
FUM $m (Jun) |
Market Share |
| Vanguard | 22 | 24 | $10,230 | $11,220 | 28.85% |
| Blackrock | 39 | 39 | $10,594 | $11,000 | 28.28% |
| State Street | 16 | 16 | $5,556 | $5,938 | 15.27% |
| Betashares | 44 | 46 | $4,592 | $5,036 | 12.95% |
| VanEck | 11 | 12 | $1,132 | $1,305 | 3.36% |
| Magellan | 3 | 3 | $1,211 | $1,298 | 3.34% |
| Russell | 6 | 6 | $642 | $653 | 1.68% |
| ETFS Securities | 15 | 15 | $975 | $1,045 | 2.69% |
| Market Vectors | 4 | 4 | $470 | $519 | 1.34% |
| Platinum | 2 | 2 | $275 | $303 | 0.78% |
| UBS | 9 | 9 | $270 | $286 | 0.73% |
| Montgomery | 1 | 1 | $72 | $81 | 0.21% |
| Switzer | 1 | 1 | $76 | $77 | 0.20% |
| Schroder | 1 | 1 | $46 | $47 | 0.12% |
| InvestSMART | 1 | $34 | 0.09% | ||
| K2 Asset Management | 2 | 2 | $33 | $31 | 0.08% |
| eInvest | 1 | $18 | 0.05% | ||
| 176 | 183 | $36,171 | $38,892 | 100.00% |
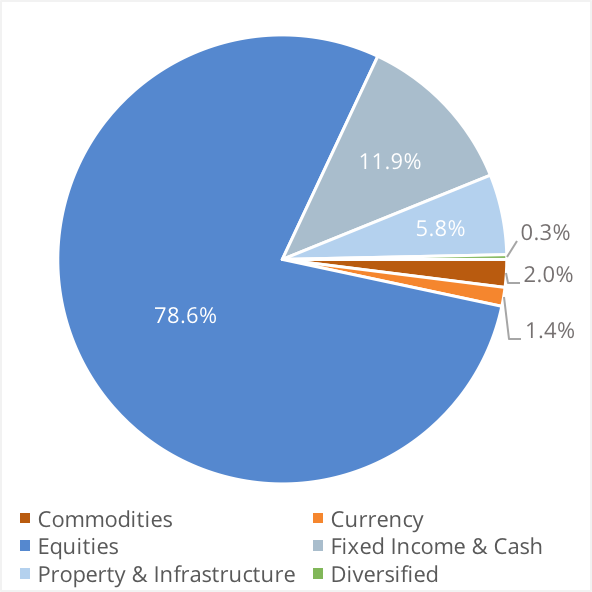
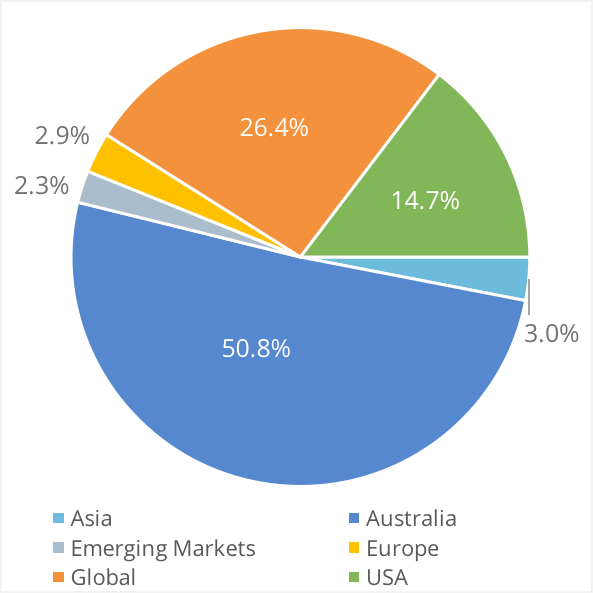
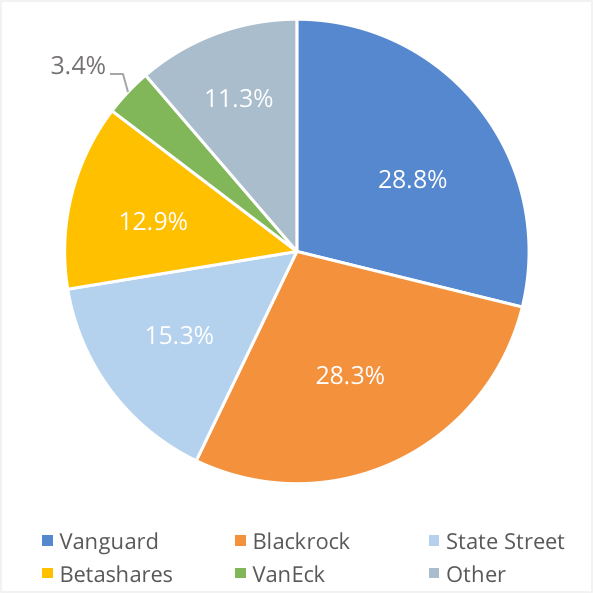
Figure 12: Australian ETP Market Breakdown
 |
 |
 |
|
Asset Class The largest asset class in terms of both product range as well as FUM is equities, representing over 75% of the market. |
Geography Geographically, the largest exposure for ETFs across the market is Australia, followed by those providing diversified global exposure. |
Issuer With combined FUM of over $30 billion, close to 90% of the Australian ETFs market is managed by five issuers, namely BlackRock, Vanguard, State Street, BetaShares and Magellan. |
Figure 10: FUM Growth - Inflows vs Performance
| Security | Fund | Asset Class | Focus |
| A200 | BetaShares Australia 200 ETF | Equities | Track the performance of the ASX200 |
| CRED | BetaShares Australian Investment Grade Corporate Bond ETF | Fixed Income & Cash | Australian Corporate Bonds |
| EIGA | eInvest Income Generator ETF | Equities | Australian companies with growing dividend streams |
| EMKT | VanEck Vectors MSCI Mltfac Emerging Markets Equities ETF | Equities | Emerging Market Equity - Multifactor (Value, Momentum, Small, Quality) |
| INIF | InvestSMART Australian Equity Income ETF | Equities | Australian companies with growing dividend streams |
| VMIN | Vanguard Global Minimum Volatil Act ETF | Equities | Low volatility Global Equities |
| VVLU | Vanguard Global Value Equity Active ETF | Equities | Value focus Global Equities |
Figure 14: Product Breakdown by Structure
Market Flows
“Equity World Large Blend” ETFs saw strong inflows, with 50% going to Vanguard, via their MSCI International ETF (VGS) and All-World ex US ETF (VEU) ETFs alone. “Equity World Other” however saw the largest net outflows. This was due in part to iShares decision to close down 5 of their ETFs, IRU, IXP, ISG, IHK & IBK*. Three of the five fall within this category.
These delisting’s came as part of iShares decision to convert a range of their internationally domiciled ETFs to be Australian domiciled. This removes the need to fill out the W8-BEN forms which we see as a positive as well as allowing investors to now participate in DRPs.
*Note, we have retained these 5 ETFs as part of our analysis as they were delisted on the 22nd of June. They will be removed in future reports.
Figure 15: Quarterly Flows
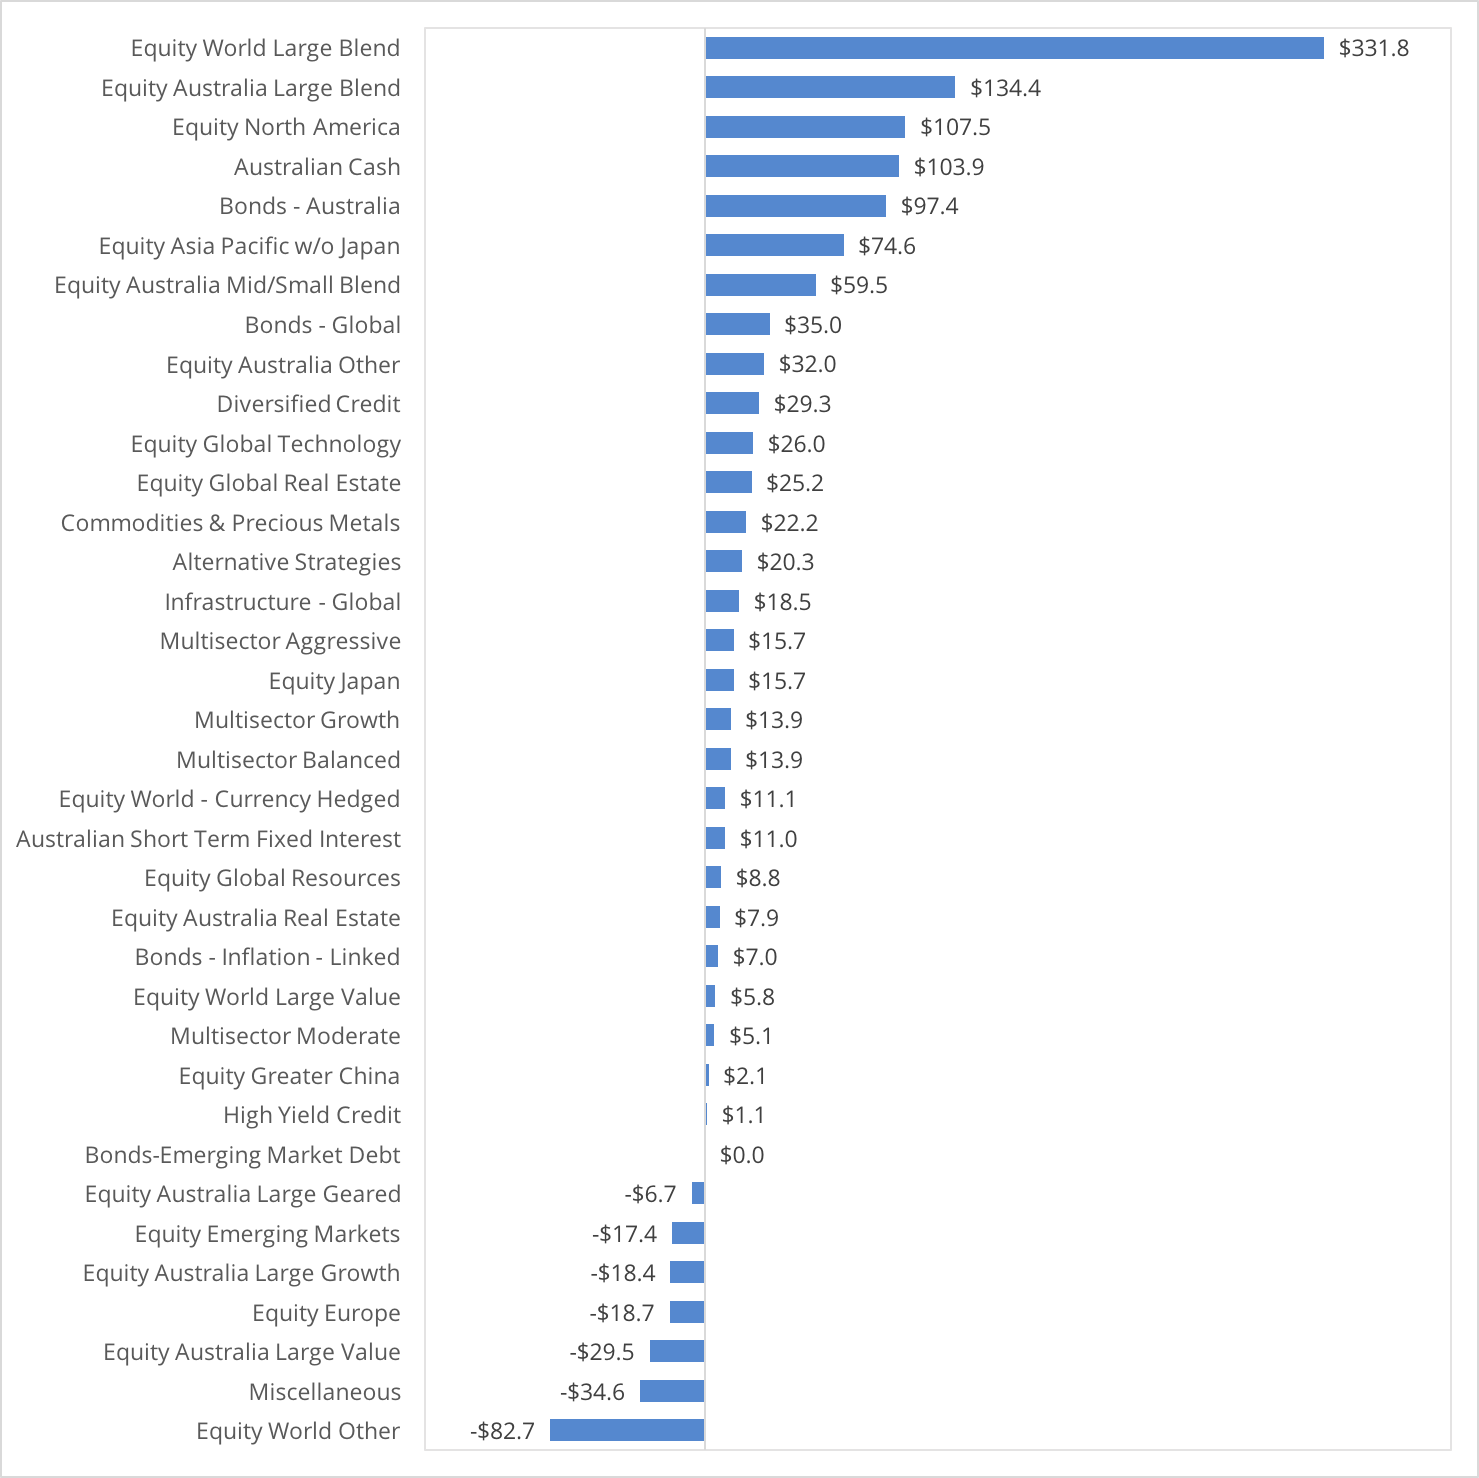
Figure 16: Cumulative FUM Flows ($M)

Figure 17: FUM Flows ($M) by Asset Class
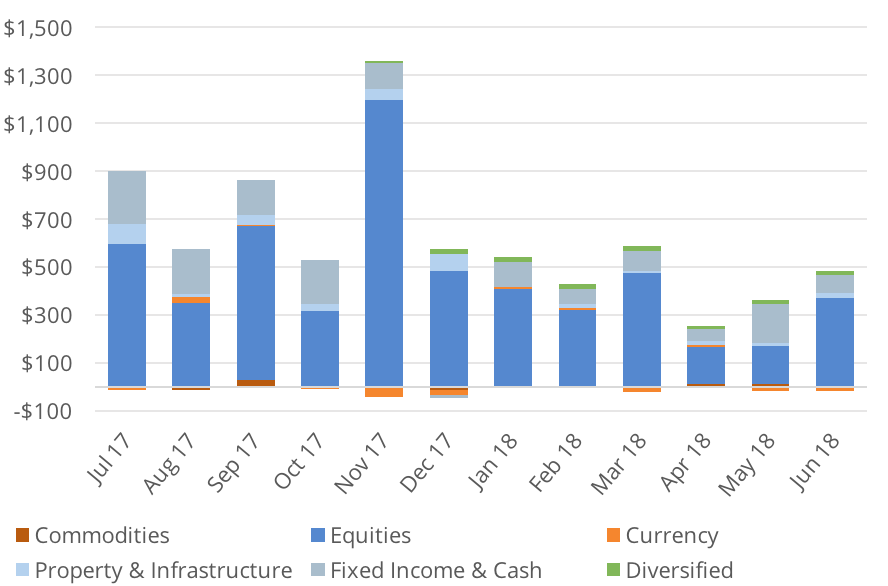
Figure 18: Largest Inlows (QTR)
| ETF | Flows ($m) | Sub Category |
| [VAS] Vanguard Australian Shares ETF | $110.68 | Equity Australia Large Blend |
| [VGS] Vanguard MSCI Index International ETF | $96.71 | Equity World Large Blend |
| [AAA] BetaShares Australian High Interest Cash ETF | $76.84 | Australian Cash |
| [VEU] Vanguard All - World ex-US Shares ETF | $67.35 | Equity World Large Blend |
| [FAIR] BetaShares Australian Sustnby Leaders ETF | $58.10 | Equity Australia Large Blend |
Figure 19: Largest Outlows (QTR)
ETF |
Qtr Flows ($m) | Sub Category |
| [IOZ] iShares Core S&P/ASX 200 ETF | $(176.30) | Equity Australia Large Blend |
| [IXP] iShares Global Telecom ETF (AU) | $(64.85) | Equity World Other |
| [IEU] iShares Europe ETF (AU) | $(43.38) | Equity Europe |
| [USD] BetaShares US Dollar ETF | $(31.41) | Miscellaneous |
| [SYI] SPDR MSCI Australia Select High Diversified Yield ETF | $(23.15) | Equity Australia Large Value |
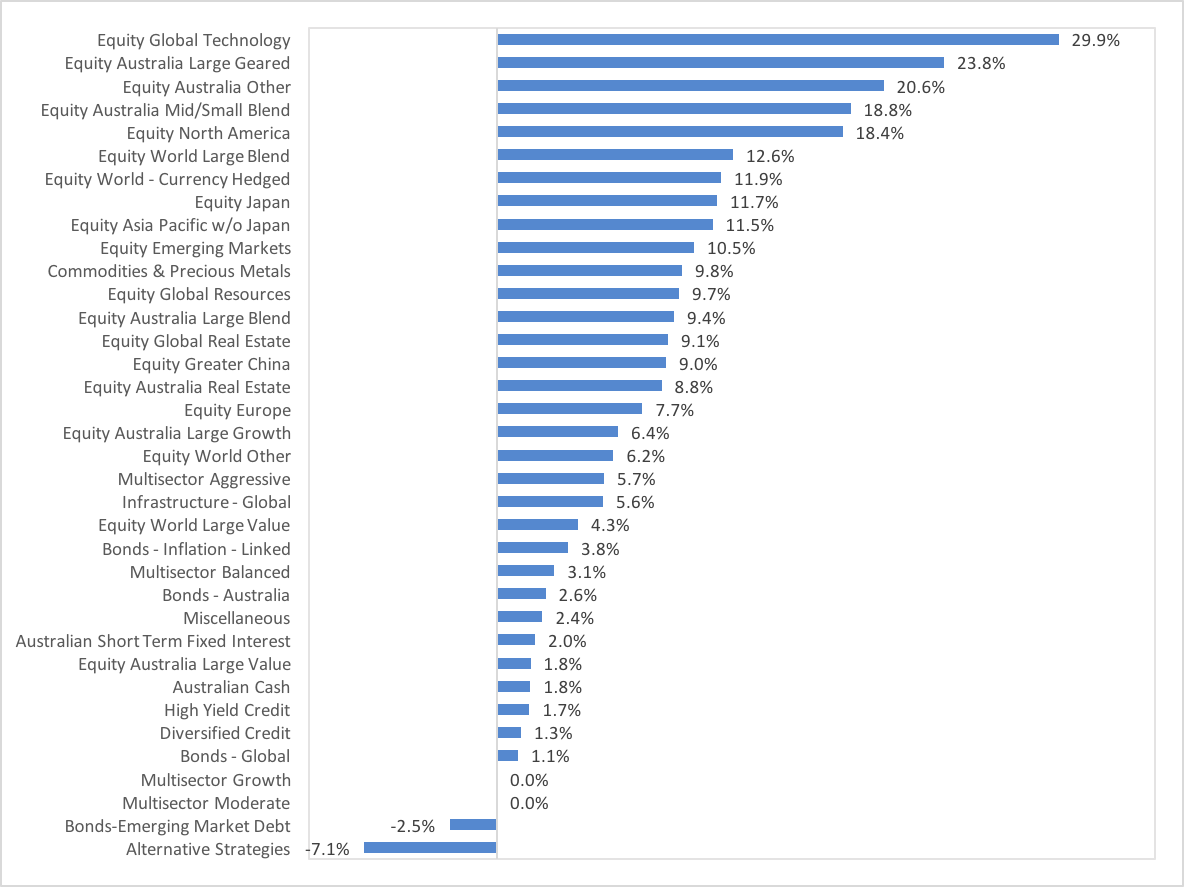
Performance
Four of the five best performing ETFs this quarter were exposed to resources, led in the main by the surge in oil pricing across the three main contracts lead by WTI adding 14% in the quarter.
Figure 20: World Oil Markets
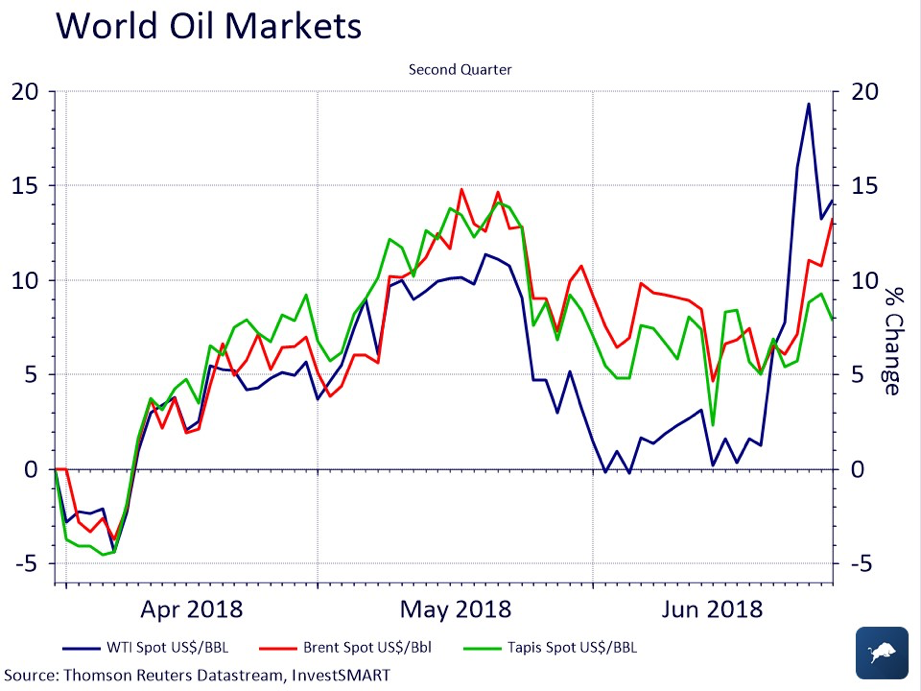
Figure 21: Top Five Performing Securities
| ETF | 3 Mnth Return | Sub Category |
| [GEAR] BetaShares Geared Australian Equity (Hedged) | 17.43% | Equity Australia Large Geared |
| [QRE] BetaShares S&P/ASX200 Res Sect ETF | 16.22% | Equity Australia Other |
| [OZR] SPDR S&P/ASX 200 Resources ETF | 16.08% | Equity Australia Other |
| [OOO] BetaShares Crude Oil ETF Currency Hedged (Synth) | 14.48% | Commodities & Precious Metals |
| [FUEL] BetaShares Global Energy Companies ETF - Currency Hedged | 14.11% | Equity Global Resources |
Figure 22: Worst Five Performing Securities
| ETF | 3 Mnth Return | Sub Category |
| [BBOZ] BetaShares Australian Equities Strong BearHdg | -17.42% | Alternative Strategies |
| [CETF] Market Vectors ChinaAMC A - Share ETF (Syn) | -11.99% | Equity Greater China |
| [AUDS] BetaShares Strong Australian Dollar Hedged | -9.40% | Alternative Strategies |
| [QAG] BetaShares Agriculture ETF Currency Hedged (Synth) | -8.23% | Miscellaneous |
| [BEAR] BetaShares Australian Equities Bear Hedge | -7.76% | Alternative Strategies |
Figure 23: Returns
| 3 months | 12 months |
 |
|
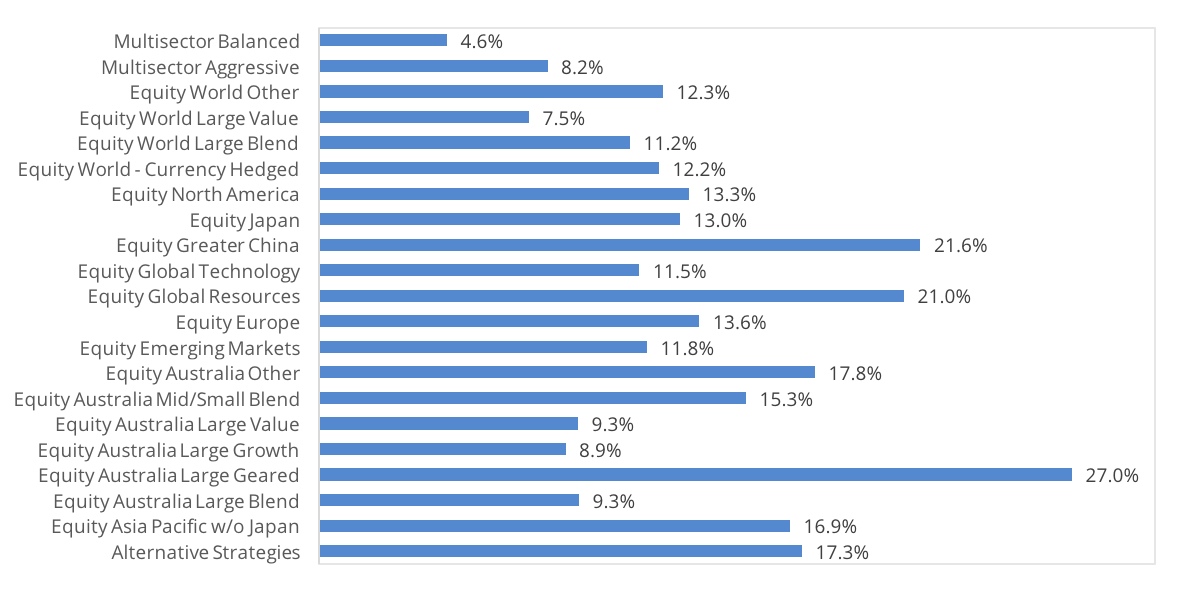
Figure 24: Sub-category volatility

Emerging markets and Asia focused ETFs were prevalent amongst the worst performers. This was due to China’s main indices entering bear markets on the beginning of the US-China trade war and concerns that debt at State-Owed Enterprises (SOE) led Beijing ramp up its financial stability program and reduce the debt risk by enacting debt reduction programs across the country.
Future Flows
Looking at the future flow of funds, already there is a clear drive to US markets – in particularly in equities and US currencies. S&P500 second-quarter earnings is on pace for its best quarter since Q4 2010 as earnings-per-share (EPS) growth hits 29% year-on-year (YoY). Stripping out FAANG firms (Facebook, Apple, Amazon, Netflix, Google), YoY EPS growth alone was 37%. The caveat, forward guidance is being coloured by the recent enacted trade tariffs and a slowing of overall global output.
Flows into fixed income markets, particularly US fixed income, will be interesting over the coming period. Currently there are a further six rate hikes forecasted by the Federal Reserve come December 2019. However pricing in the US bond market has been rather dislocated with the 2 year bond pricing in these hikes accordingly, the 10 year bond however has remained depressed suggesting the market sees some longer term risk to higher rates. The flattening yield curve may be a signal to risk investment which would mean some short term volatility in equities.
Looking to other parts of the fixed income market, for the first time since the GFC, the yield on the 3-month Treasury Bill crossed over the dividend yield of the S&P 500. Again, we will be watching for flows across asset classes if this remains.
Resilience of growth assets over the past five years is testament to the market taking a longer term view; meaning any short term volatility or risk off flows are being seen as a long term buying opportunity into international markets.
<Add IS International Equities Promo banner>
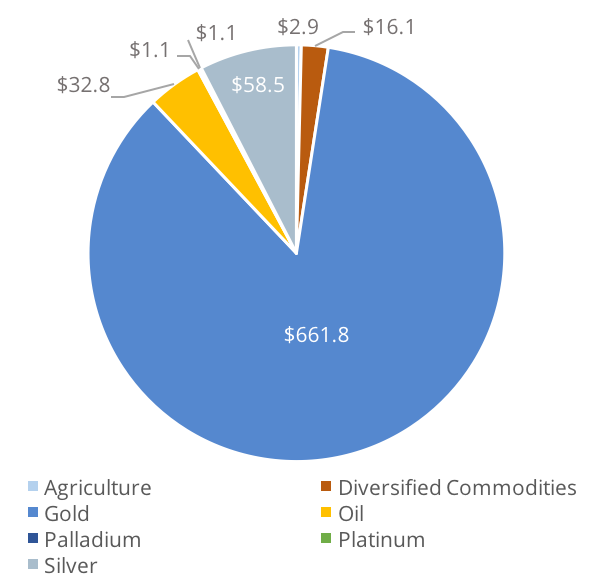
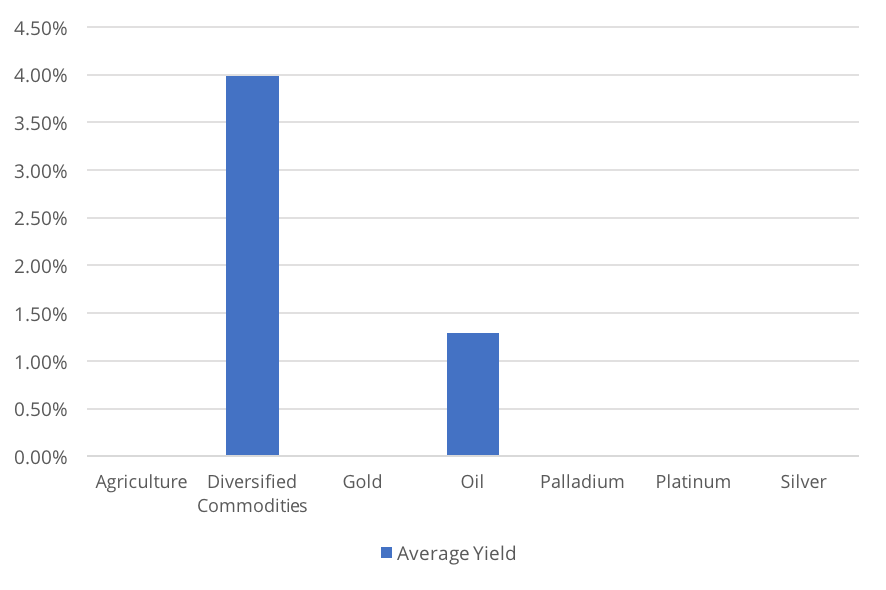
Commodities
| Total FUM ($m) | Qtr Flows ($m) | No. Funds |
| $ 774.00 | $ 22.00 | 10 |
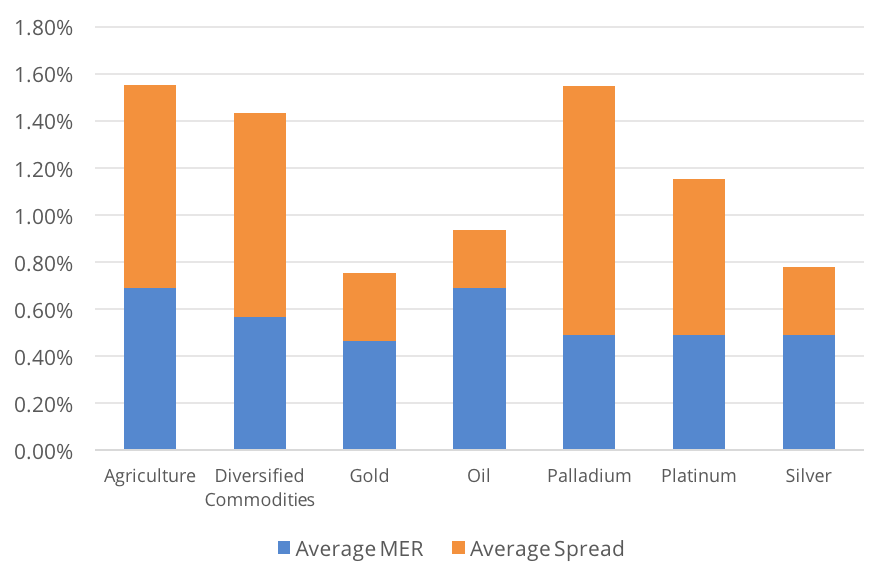
Strong performance in Oil as represented by the ETF OOO up 14.5% this qtr. The surge in oil over the quarter was down to two main events. The first being OPEC’s annual Vienna convention which, despite seeing an agreement to increase oil production over the coming year the organisation released data showing that for the first time in over 5 years OPEC is in shortfall rather than surplus.
The second more WTI specific event was news out of Canada’s Syncrude sand facility which suffered an outage in June which has the potential leave North America 360 kilo barrels of oil a day short. The concern then turned to the Cushing Oil Hub in Oklahoma which was at one point on track for an inventory stockout. This event explains the large spike in WTI in mid-June.
Despite negative performance in Gold ETFs, the metal saw the strongest inflows of the category with $24.3m. Interestingly, one would have assume that risk events such as the US-China trade war, would have been a gold driver. However, what is clear is the risk to the gold price isn’t political (upside risk) its monetary policy tightening (downside risk) from the Federal Reserve, rising real rates are a sign of economy growth and is something that does not require a ‘hedge’ product such as gold.
Figure 25: Funds Under Management ($M) |
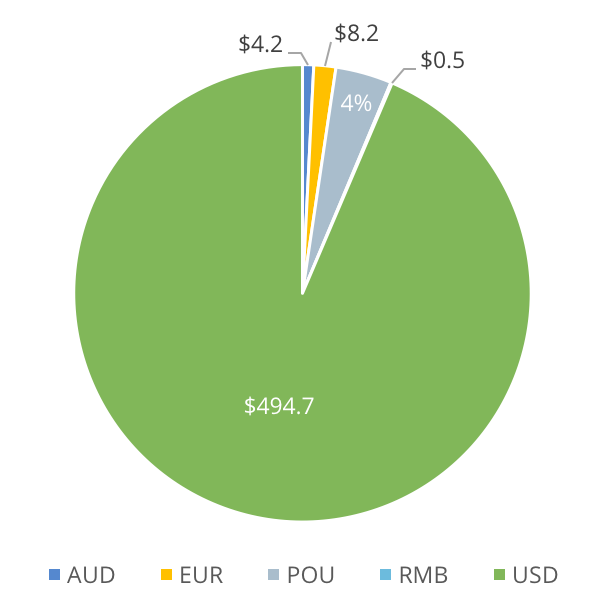
Figure 26: Geographic Exposure |
Figure 27: Flows ($M) |
 |
 |
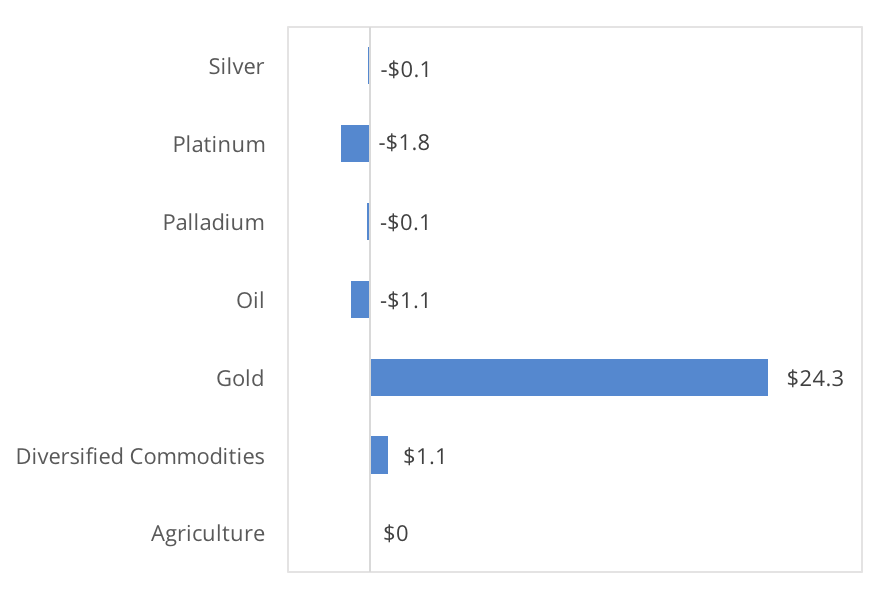 |
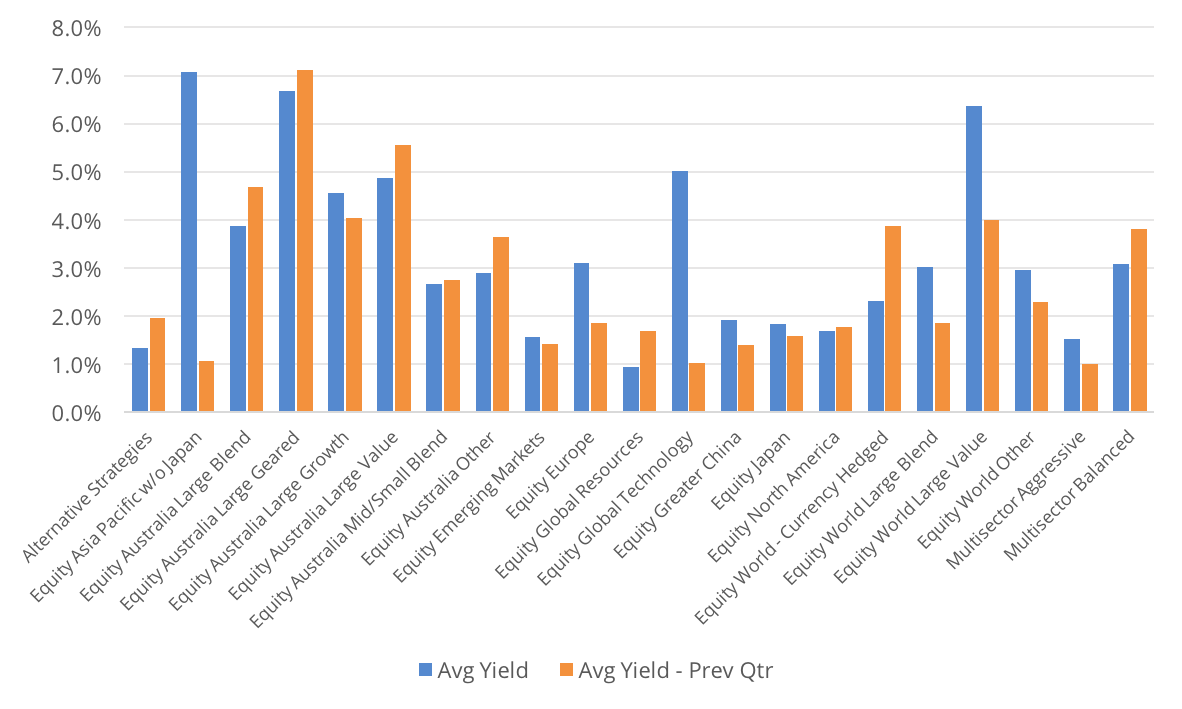
Figure 28: Average Yield |
Figure 29: Total Costs |
Figure 30: Performance |
 |
 |
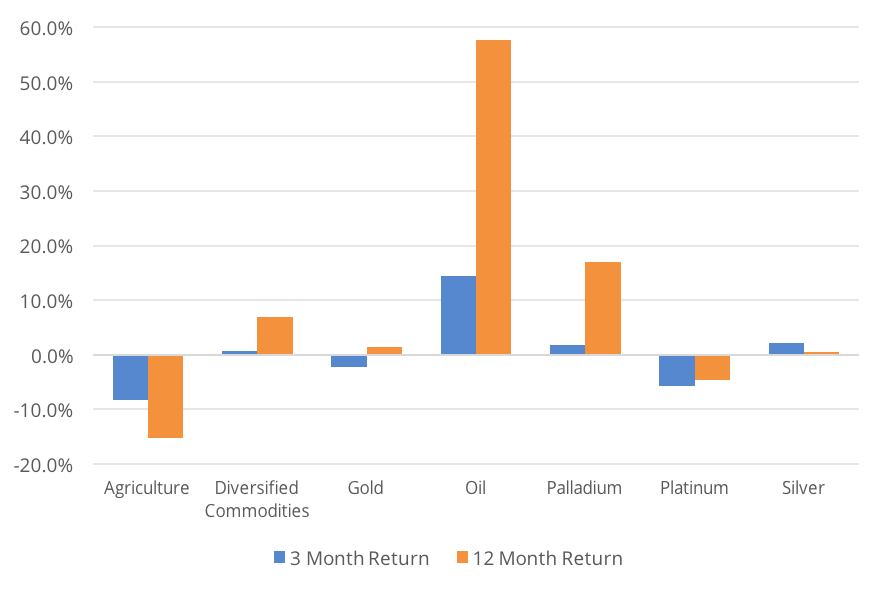 |
Figure 31: Average Annual Volatility |
|
|
 |
||
Currency
| Total FUM ($m) | Qtr Flows ($m) | No. Funds |
| $ 528.00 | $(31.30) | 7 |
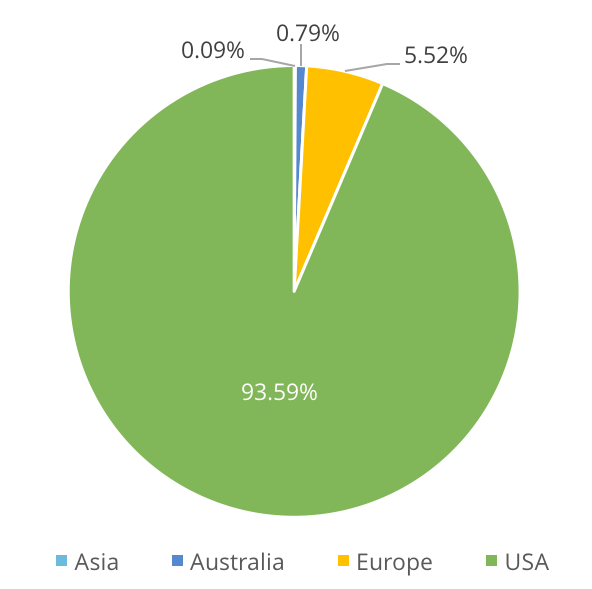
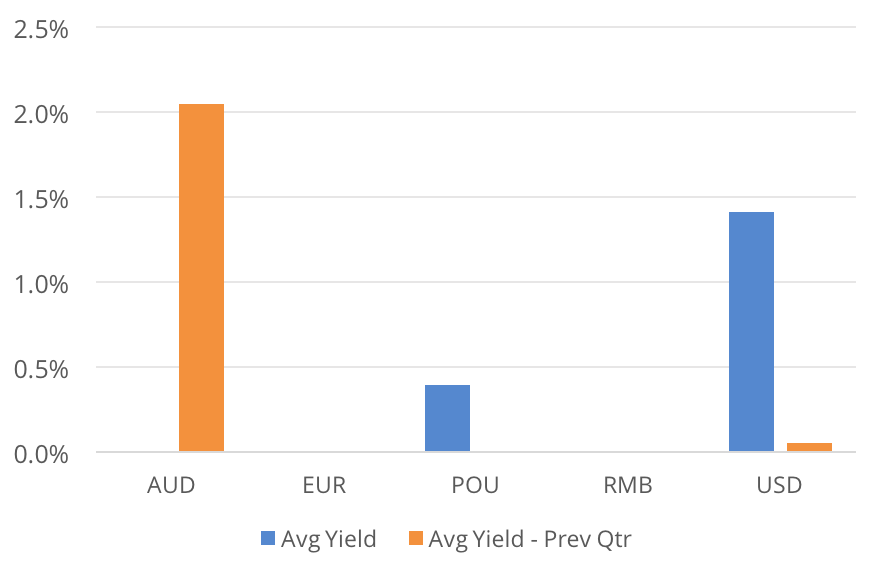
USD was the best performing currency across the category, up 5.5% on average for the qtr. However, USD ETFs also saw largest outflows, -$27.9m. This was largely due to the ETFUSD with $31.41m in outflows. The US performance was down to several factors, first was the collapse in the EUR as the White House levelled threat after threat at the European Union and more specifically Germany. Considering the weighting EURUSD has in the trade weighted USD basket this goes a long way to explaining the increase in the ETF markets. Secondly for the seventh time since December 2015 the US Federal Reverse raised rates and brought forward rate rise expectations for 2018 and 2019 another driver of the USD.
Figure 33: Funds Under Management ($M) |
Figure 34: Geographic Exposure |
Figure 35: Flows ($M) |
 |
 |
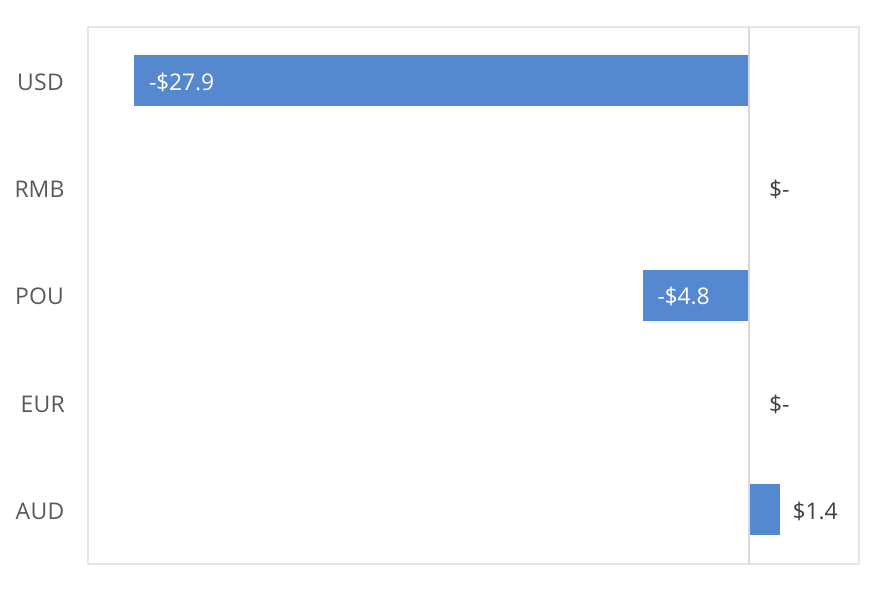  |
Figure 36: Average Yield |
Figure 37: Total Costs |
Figure 38: Performance |
 |
 |
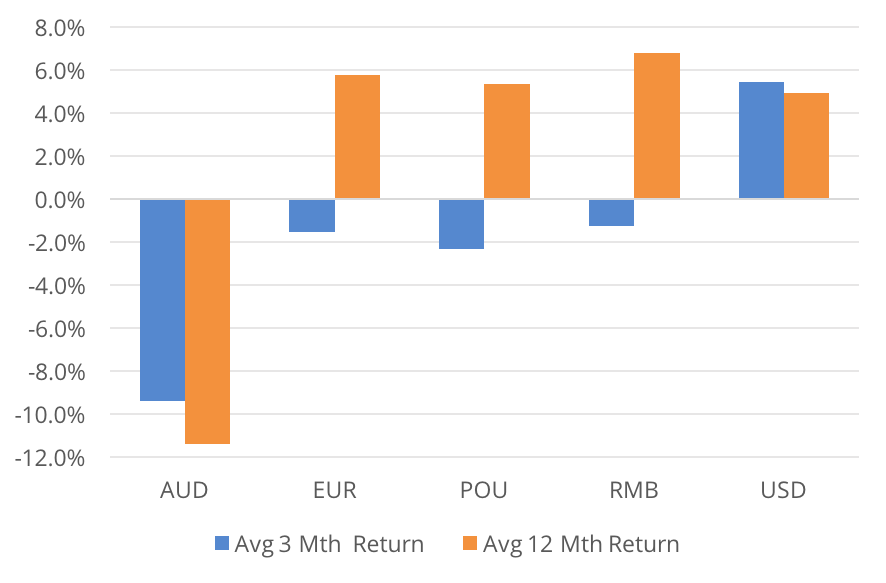 |
Figure 39: Average Annual Volatility |
||
 |
||
Figure 40: Currency ETFs
| FUM ($m) | Costs | Performance | Income | Categorisation | ||||||||
| Security | Total FUM | Qtr Flows | MER | Avg Spread | Avg Liquidity | 3 Months | 12 Months | Yield | Frequency | Structure | Sub Category | Star Rating |
| ASIA | ||||||||||||
| RMB | ||||||||||||
| [ZCNH] ETFS Physical Renminbi ETF | $0.49 | $- | 0.30% | 0.31% | 5.65% | -1.26% | 6.79% | 0.00% | Annual | ETF | Miscellaneous | 2 |
| EUROPE | ||||||||||||
| EUR | ||||||||||||
| [EEU] BetaShares Euro ETF | $8.24 | $- | 0.45% | 0.12% | 11.80% | -1.55% | 5.79% | 0.00% | Semi-Annual | ETF | Miscellaneous | 3 |
| [POU] BetaShares British Pound ETF | $20.98 | $(4.79) | 0.45% | 0.10% | 9.02% | -2.32% | 5.33% | 0.39% | Semi-Annual | ETF | Miscellaneous | 3 |
| AUSTRALIA | ||||||||||||
| AUD | ||||||||||||
| [AUDS] BetaShares Strong Australian Dollar Hedged | $4.19 | $1.40 | 1.38% | 0.21% | 48.17% | -9.40% | -11.39% | 0.00% | Annual | MF | Alternative Strategies | NR |
| USA | ||||||||||||
| USD. | ||||||||||||
| [USD] BetaShares US Dollar ETF | $462.91 | $(31.41) | 0.45% | 0.10% | 10.86% | 4.07% | 4.27% | 0.79% | Semi-Annual | ETF | Miscellaneous | 5 |
| [YANK] BetaShares Strong US Dollar Hedge | $11.88 | $(2.88) | 1.38% | 0.18% | 36.89% | 8.17% | 5.85% | 2.96% | Annual | MF | Alternative Strategies | NR |
| [ZUSD] ETFS Physical US Dollar ETF | $19.87 | $6.39 | 0.30% | 0.18% | 20.04% | 4.15% | 4.61% | 0.49% | Annual | ETF | Miscellaneous | 3 |
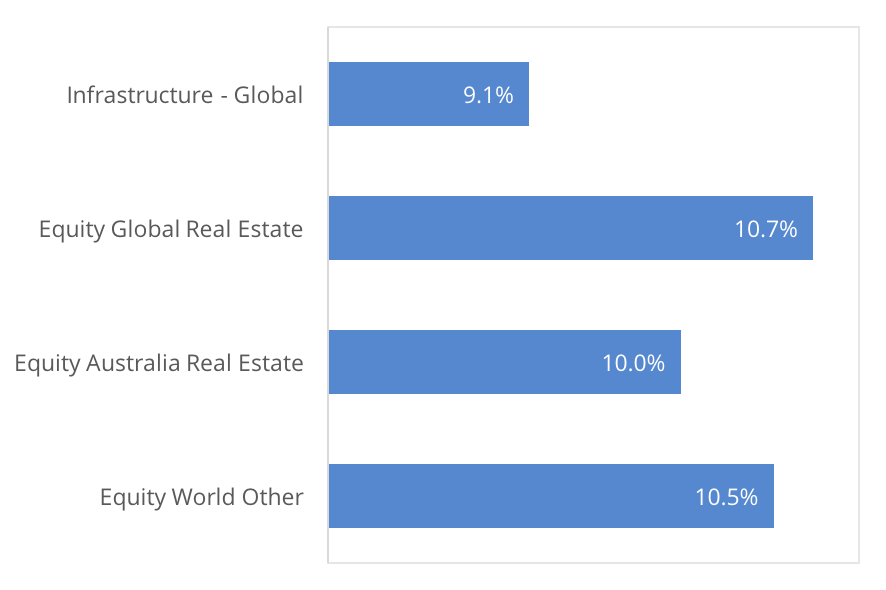
Property & Infrastructure
| Total FUM ($m) | Qtr Flows ($m) | No. Funds |
| $ 2,249.00 | $ 51.60 | 10 |
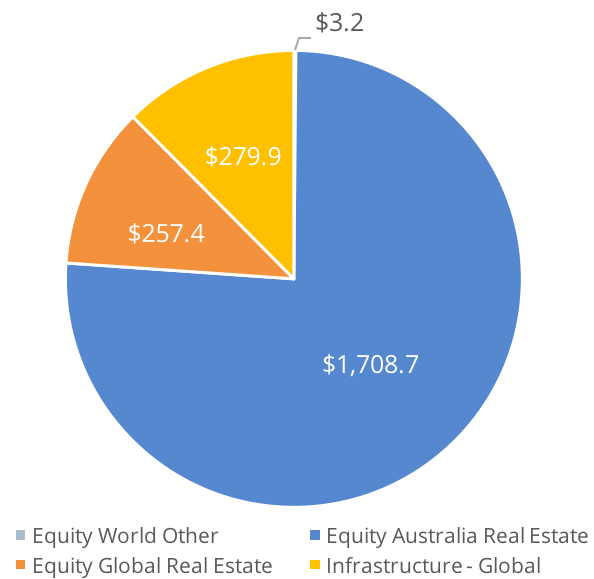
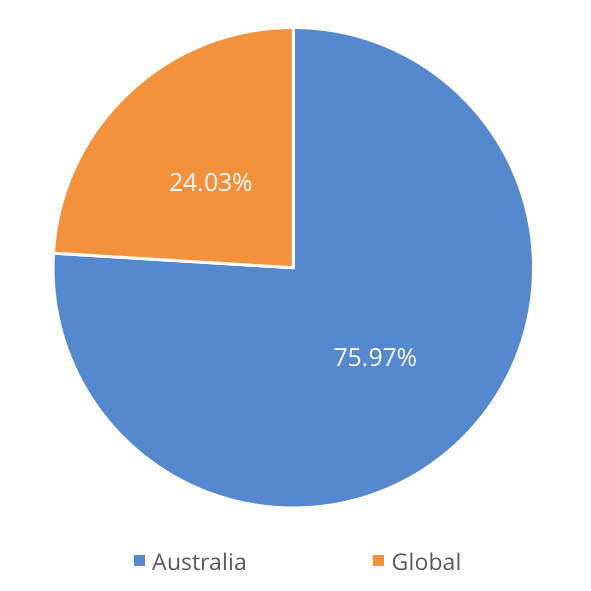
Reversing last quarters fortunes, Property and Infrastructure ETFs saw positive performance for the June Qtr. Australian and International REITs seeing returns in excess of 8%. Internationally focused ETFs however saw the strongest net inflows at $43.7m.
Figure 41: Funds Under Management ($M) |
Figure 42: Geographic Exposure |
Figure 43: Flows ($M) |
 |
 |
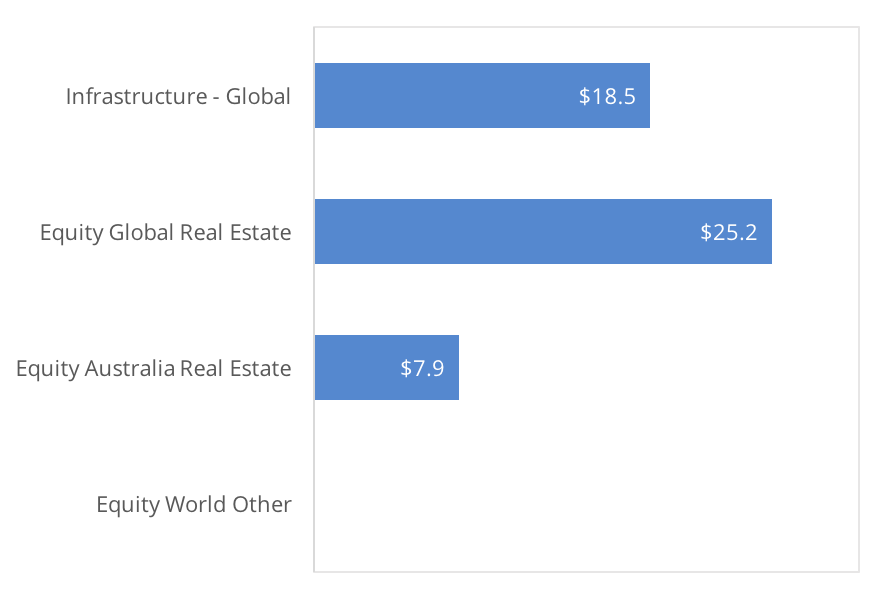 |
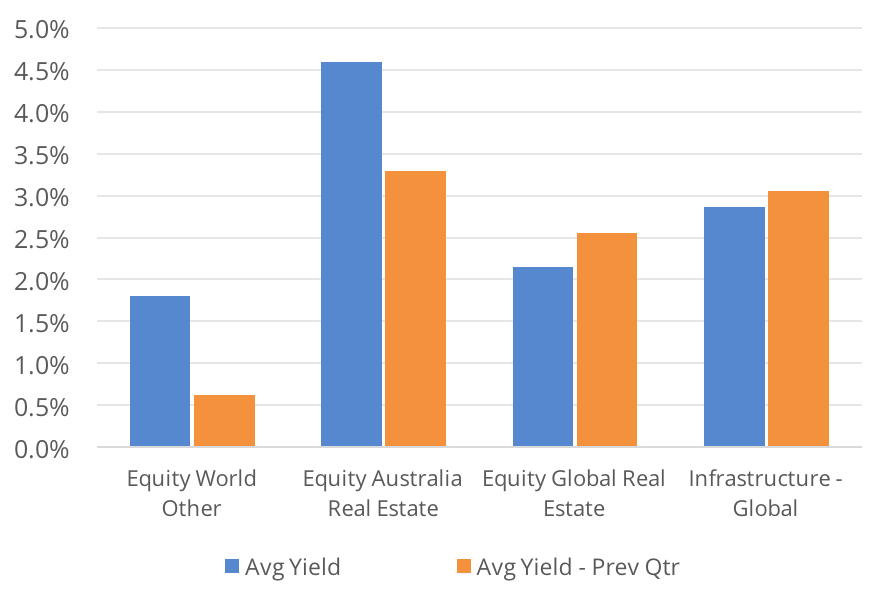
Figure 44: Average Yield |
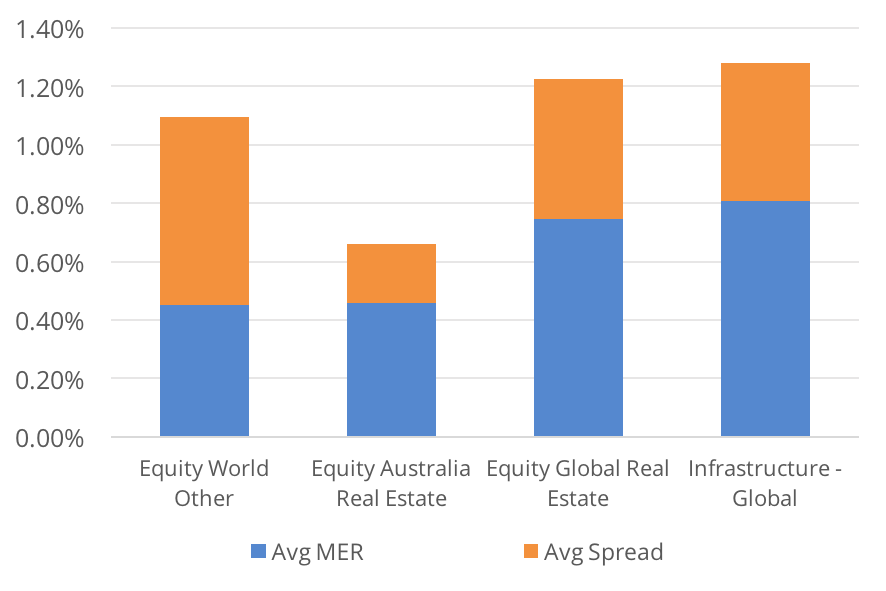
Figure 45: Total Costs |
Figure 46: Performance |
 |
 |
 |
Figure 47: Average Annual Volatlity |
|
|
 |
||
Invest in the InvestSMART Property and Infrastructure Portfolio
Figure 48: Property and Infrastructure ETFs
| FUM ($m) | Costs | Performance | Income | Categorisation | ||||||||
| Security | Total FUM | Qtr Flows | MER | Avg Spread | Avg Liquidity | 3 Months | 12 Months | Yield | Frequency | Structure | Sub Category | Star Rating |
| AUSTRALIA | ||||||||||||
| Property | ||||||||||||
| [MVA] VanEck Vectors Australian Property ETF | $119.87 | $5.64 | 0.35% | 0.13% | 5.42% | 10.15% | 12.29% | 4.81% | Semi-Annual | ETF | Equity Australia Real Estate | 4 |
| [SLF] SPDR S&P/ASX 200 Listed Property ETF | $554.02 | $(18.27) | 0.40% | 0.14% | 3.61% | 9.79% | 12.42% | 8.64% | Quarterly | ETF | Equity Australia Real Estate | 4 |
| [VAP] Vanguard Australian Property Securities ETF | $1,024.33 | $18.06 | 0.23% | 0.07% | 4.53% | 7.08% | 10.31% | 2.85% | Quarterly | ETF | Equity Australia Real Estate | 4 |
| Property & Infrastructure | ||||||||||||
| [RINC] BetaShares Legg Mason Real Income Fund | $10.47 | $2.52 | 0.85% | 0.46% | 9.30% | 7.07% | 0.00% | 2.07% | Quarterly | MF | Equity Australia Real Estate | NR |
| GLOBAL | ||||||||||||
| Infrastructure | ||||||||||||
| [GLIN] AMP Capital - Global Infrastructure Securities Unhedged | $23.56 | $(0.36) | 0.85% | 0.74% | 2.88% | 9.13% | 5.97% | 2.14% | Quarterly | MF | Infrastructure - Global | NR |
| [IFRA] VanEck Vectors FTSE Global Infrastructure (Hedged) ETF | $77.07 | $2.30 | 0.52% | 0.23% | 8.94% | 6.03% | 3.94% | 3.70% | Quarterly | ETF | Infrastructure - Global | 3 |
| [MICH] Magellan Infrastructure Currency Hedged ETF | $179.30 | $16.56 | 1.05% | 0.45% | 4.47% | 4.87% | 6.96% | 2.75% | Semi-Annual | MF | Infrastructure - Global | NR |
| [CORE] ETFS Global Core Infrastructure ETF | $3.18 | $0.00 | 0.45% | 0.64% | 2.56% | 5.79% | 0.00% | 1.80% | Quarterly | ETF | Equity World Other | 2 |
| Property | ||||||||||||
| [DJRE] SPDR Dow Jones Global Real Estate ETF | $242.48 | $24.85 | 0.50% | 0.16% | 7.26% | 9.24% | 7.88% | 2.92% | Semi-Annual | ETF | Equity Global Real Estate | 3 |
| [RENT] AMP Capital - Global Property Securities Unhedged | $14.93 | $0.34 | 0.99% | 0.80% | 2.03% | 8.01% | 10.30% | 1.38% | Quarterly | MF | Equity Global Real Estate | NR |
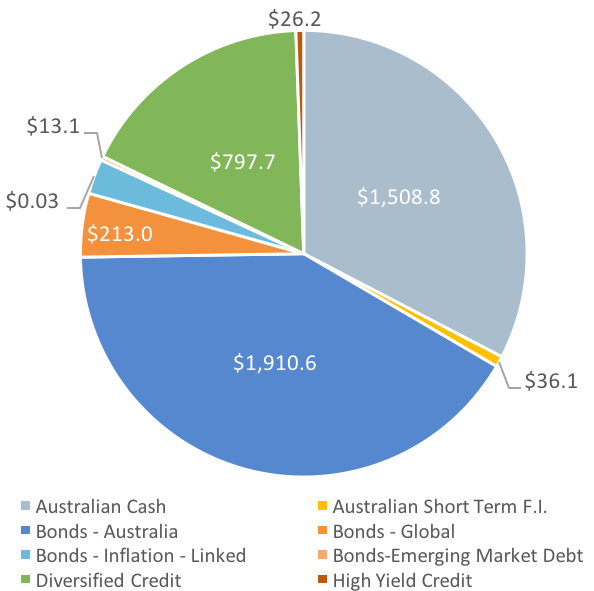
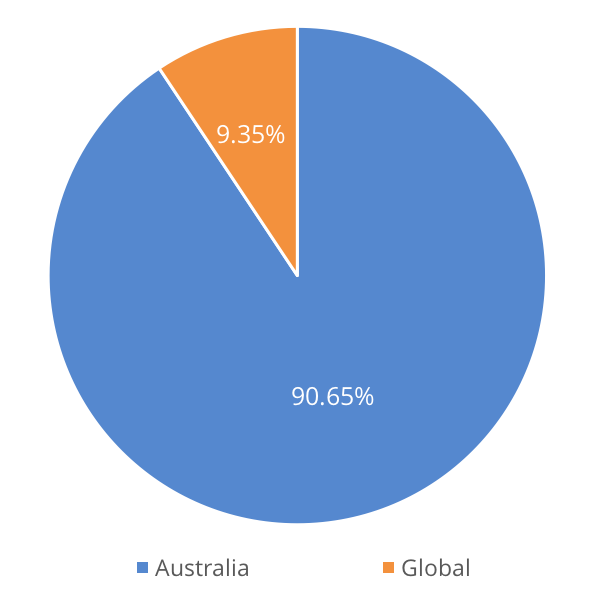
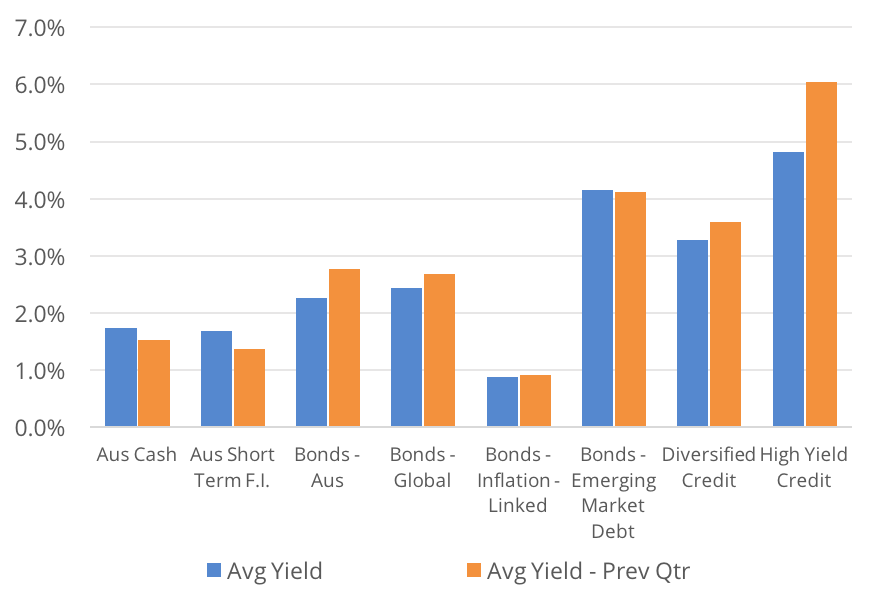
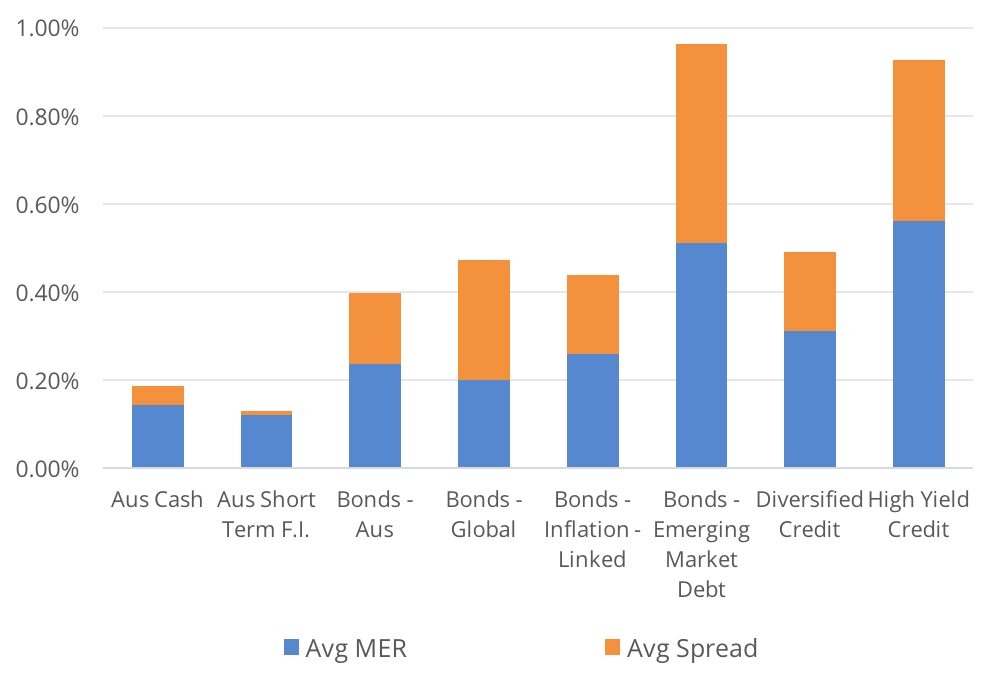
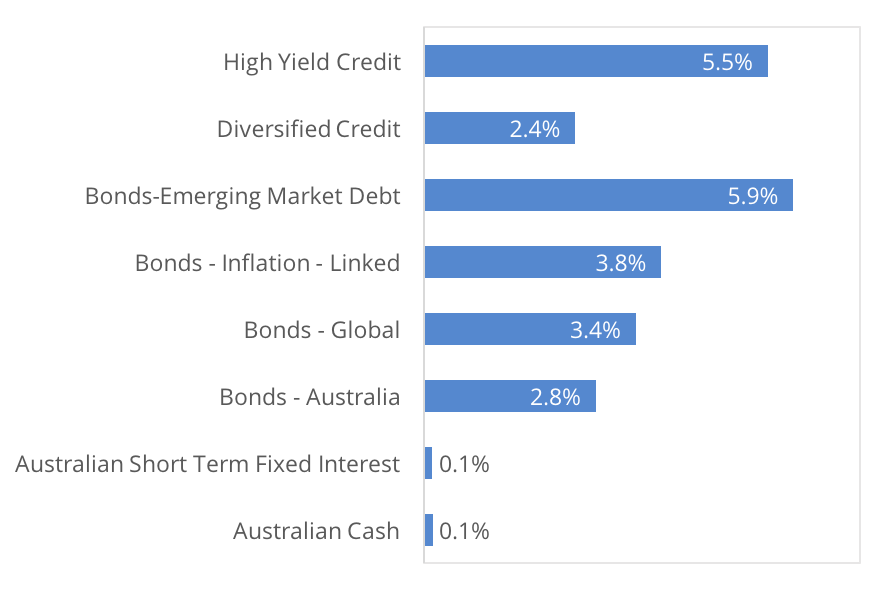
Fixed Income & Cash
| Total FUM ($m) | Qtr Flows ($m) | No. Funds |
| $ 4,622.00 | $ 284.60 | 26 |
A strong June saw HBRD as best performing ETF of the category for the June Qtr, up 1.89%. On the flip side, emerging market bonds were particularly weak with IHEB down 4.13%. We saw strong inflows to Australian Cash and Bond products with greater than $200m in net inflows.
Figure 49: Funds Under Management ($M) |
Figure 50: Geographic Exposure |
Figure 51: Flows ($M) |
 |
 |
 |
Figure 52: Average Yield |
Figure 53: Total Costs |
Figure 54: Performance |
 |
 |
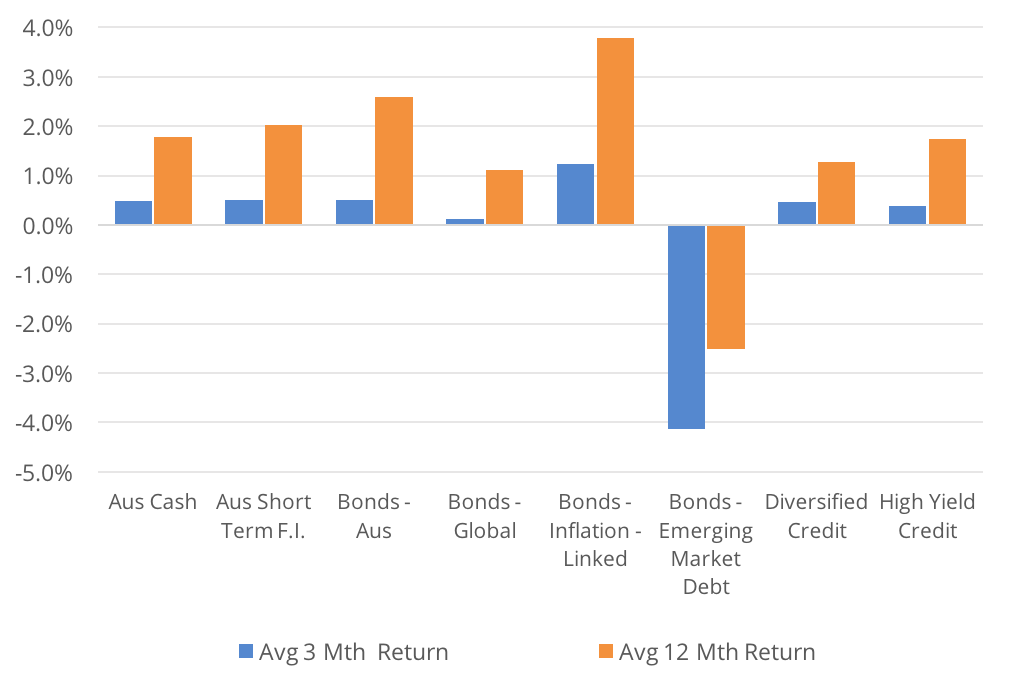 |
Figure 55: Average Annual Volatlity |
|
|
 |
||
with the InvestSMART Hybrid Income Portfolio
Figure 56: Fixed Income and Cash ETFs
| FUM ($m) | Costs | Performance | Income | Categorisation | ||||||||
| Security | Total FUM | Qtr Flows | MER | Avg Spread | Avg Liquidity | 3 Months | 12 Months | Yield | Frequency | Structure | Sub Category | Star Rating |
| GLOBAL | ||||||||||||
| Corporate | ||||||||||||
| [IHCB] iShares Core Global Corporate Bond AUDH ETF | $80.74 | $(6.18) | 0.26% | 0.27% | 10.73% | -0.56% | 0.08% | 2.77% | Tri-Annual | ETF | Diversified Credit | 3 |
| [IHHY] iShares Global High Yield Bond AUDH ETF | $26.17 | $1.06 | 0.56% | 0.37% | 7.66% | 0.38% | 1.73% | 4.82% | Tri-Annual | ETF | High Yield Credit | 2 |
| Diversified | ||||||||||||
| [IHEB] iShares JP Morgan USD Emerging Markets Bond AUDH ETF | $13.07 | $0.00 | 0.51% | 0.45% | 13.87% | -4.13% | -2.52% | 4.14% | Tri-Annual | ETF | Bonds-Emerging Market Debt | 2 |
| [VCF] Vanguard International Credit Securities Index (Hedged) ETF | $99.42 | $(15.80) | 0.30% | 0.28% | 11.28% | -0.20% | 1.01% | 6.05% | Quarterly | ETF | Diversified Credit | 3 |
| [VBND] Vanguard Global Aggregate Bond Hedged ETF | $16.73 | $8.74 | 0.20% | 0.32% | 24.18% | 0.04% | 0.00% | 0.94% | Quarterly | ETF | Bonds - Global | 2 |
| Government | ||||||||||||
| [VIF] Vanguard International Fixed Interest Index (Hedged) ETF | $196.25 | $26.23 | 0.20% | 0.22% | 9.10% | 0.21% | 2.23% | 3.93% | Quarterly | ETF | Bonds - Global | 3 |
| AUSTRALIA | ||||||||||||
| Cash | ||||||||||||
| [AAA] BetaShares Australian High Interest Cash ETF | $1,310.72 | $76.84 | 0.18% | 0.02% | 14.35% | 0.51% | 2.02% | 2.02% | Monthly | ETF | Australian Cash | 5 |
| [BILL] iShares Core Cash ETF | $197.04 | $27.08 | 0.07% | 0.01% | 7.63% | 0.49% | 1.79% | 1.50% | Monthly | ETF | Australian Cash | 5 |
| [ISEC] iShares Enhanced Cash ETF | $36.13 | $11.04 | 0.12% | 0.01% | 24.59% | 0.50% | 2.02% | 1.68% | Monthly | ETF | Australian Short Term Fixed Interest | 4 |
| [MONY] UBS IQ Cash ETF | $1.00 | $0.00 | 0.18% | 0.10% | 3.54% | 0.44% | 1.50% | 1.69% | Monthly | ETF | Australian Cash | 4 |
| Corporate | ||||||||||||
| [PLUS] VanEck Vectors Australian Corp Bd ETF | $195.44 | $18.93 | 0.32% | 0.22% | 5.25% | 0.55% | 3.97% | 3.54% | Quarterly | ETF | Diversified Credit | 3 |
| [RCB] Russell Investment Australian Select Corporate Bond ETF | $165.36 | $6.07 | 0.28% | 0.24% | 4.16% | -0.22% | 2.90% | 3.33% | Quarterly | ETF | Bonds - Australia | 3 |
| [VACF] Vanguard Australian Corp Fixed Interest ETF | $126.67 | $26.48 | 0.26% | 0.18% | 10.00% | 0.66% | 3.69% | 2.44% | Quarterly | ETF | Bonds - Australia | 4 |
| [FLOT] VanEck Vectors Australian Floating Return ETF | $85.28 | $4.02 | 0.22% | 0.08% | 11.52% | 0.53% | 0.00% | 2.41% | Monthly | ETF | Diversified Credit | 4 |
| [QPON] Betashares Australian Bank Sr Floating Return Bond ETF | $236.70 | $(10.16) | 0.22% | 0.04% | 12.59% | 0.60% | 2.54% | 2.47% | Monthly | ETF | Diversified Credit | 4 |
| [CRED] BetaShares Australian Investment Geared Corporate Bond ETF | $4.02 | $4.02 | 0.25% | 0.15% | 49.01% | 0.00% | 0.00% | 0.29% | Monthly | ETF | Bonds - Australia | 2 |
| Diversified | ||||||||||||
| [IAF] iShares Core Composite Bond ETF | $583.48 | $54.23 | 0.20% | 0.07% | 6.53% | 0.77% | 2.89% | 2.27% | Quarterly | ETF | Bonds - Australia | 4 |
| [VAF] Vanguard Australian Fixed Interest ETF | $704.84 | $1.25 | 0.20% | 0.06% | 3.94% | 0.75% | 2.91% | 2.91% | Quarterly | ETF | Bonds - Australia | 4 |
| Government | ||||||||||||
| [BOND] SPDR S&P/ASX Australian Bond ETF | $23.48 | $0.02 | 0.24% | 0.15% | 4.92% | 0.76% | 2.95% | 2.56% | Quarterly | ETF | Bonds - Australia | 3 |
| [GOVT] SPDR S&P/ASX Australian Government Bond ETF | $12.98 | $0.00 | 0.22% | 0.17% | 2.43% | 0.79% | 2.73% | 2.14% | Quarterly | ETF | Bonds - Australia | 3 |
| [IGB] iShares Treasury ETF | $30.86 | $5.17 | 0.26% | 0.14% | 9.55% | 0.71% | 2.71% | 2.13% | Quarterly | ETF | Bonds - Australia | 3 |
| [ILB] iShares Government Inflation ETF | $117.08 | $6.96 | 0.26% | 0.18% | 4.16% | 1.23% | 3.78% | 0.87% | Quarterly | ETF | Bonds - Inflation - Linked | 3 |
| [RGB] Russell Investment Australian Government Bond ETF | $60.53 | $0.00 | 0.24% | 0.26% | 1.06% | 0.20% | 2.45% | 2.02% | Quarterly | ETF | Bonds - Australia | 3 |
| [RSM] Russell Investment Australian Semi-Government Bond ETF | $61.14 | $0.02 | 0.26% | 0.24% | 2.28% | 0.38% | 2.43% | 2.01% | Quarterly | ETF | Bonds - Australia | 3 |
| [VGB] Vanguard Australian Government Bond ETF | $137.18 | $0.12 | 0.20% | 0.10% | 5.97% | 0.78% | 2.81% | 2.83% | Quarterly | ETF | Bonds - Australia | 4 |
| Hybrids | ||||||||||||
| [HBRD] BetaShares Active Australian Hybrids Fund (managed fund) | $100.10 | $38.44 | 0.55% | 0.17% | 17.34% | 1.89% | 0.00% | 2.40% | Monthly | MF | Diversified Credit | NR |
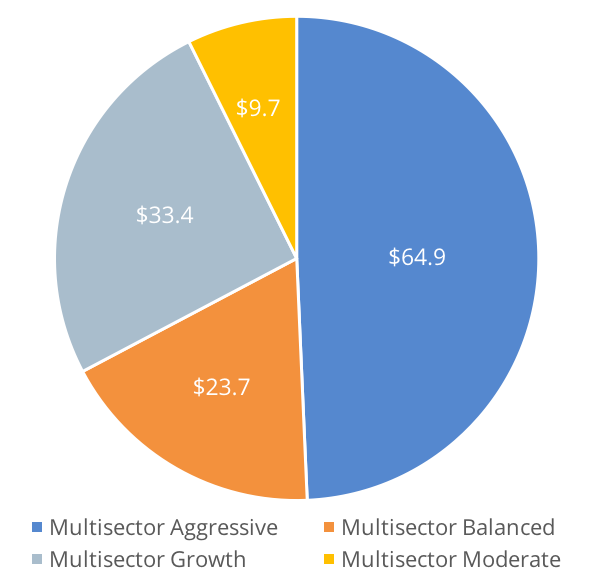
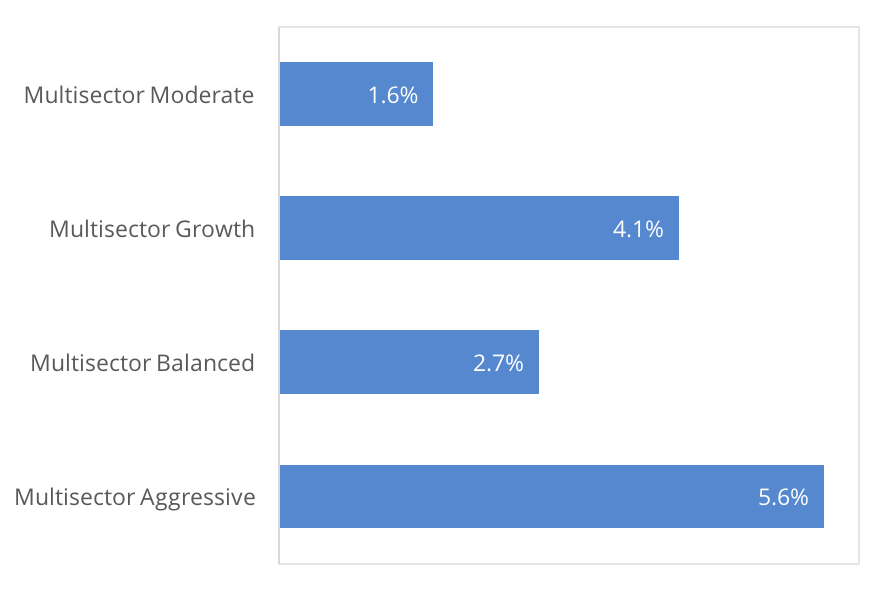
Diversified
| Total FUM ($m) | Qtr Flows ($m) | No. Funds |
| $ 131.00 | $ 48.70 | 4 |
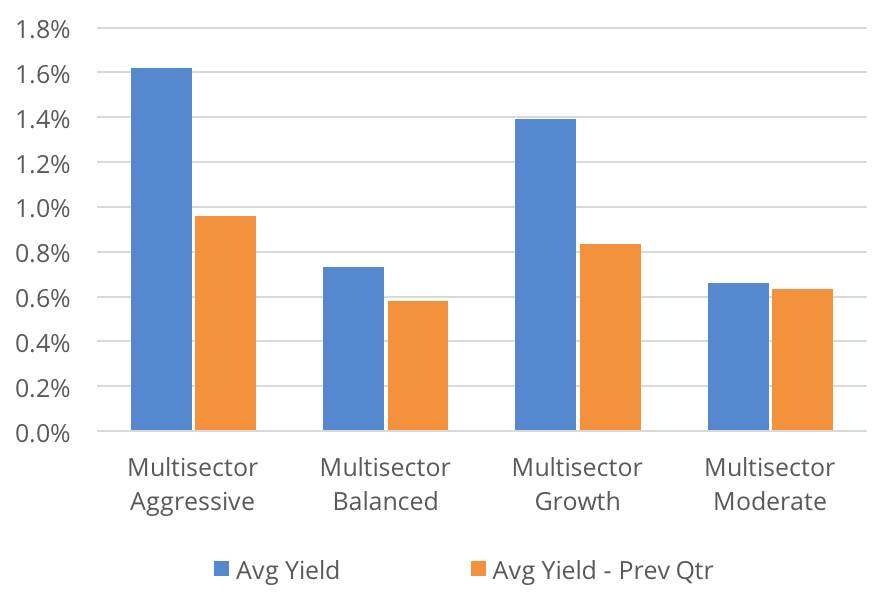
Strong equity markets saw growth orientated funds as best performing for the June Qtr. This also translated to flows, with growth orientated funds also seeing the majority of net inflows. Multisector ‘Aggressive’, or ‘High Growth’ focused funds account for almost 50% of the category based on FUM. This is not unsurprising as we find most investors tend to gravitate to growth orientated diversified products rather than the more conservative ones.
Figure 49: Funds Under Management ($M) |
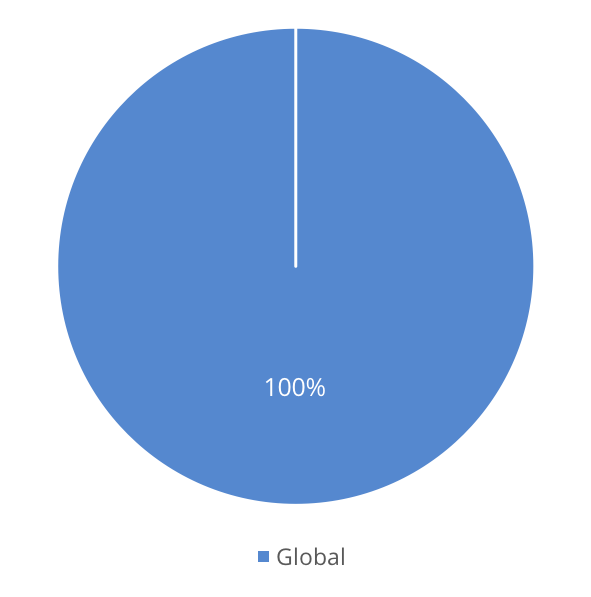
Figure 50: Geographic Exposure |
Figure 51: Flows ($M) |
 |
 |
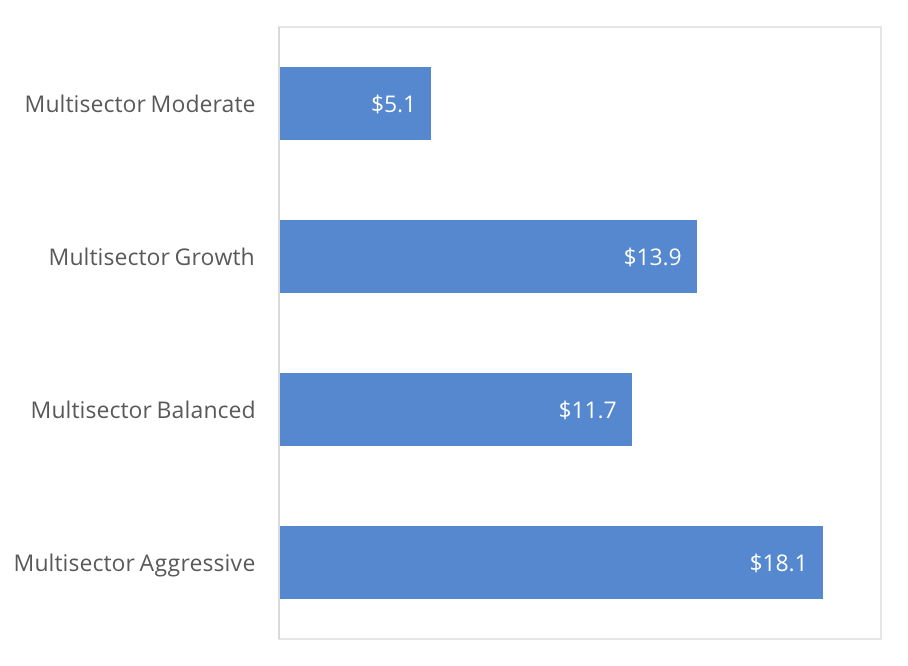 |
Figure 52: Average Yield |
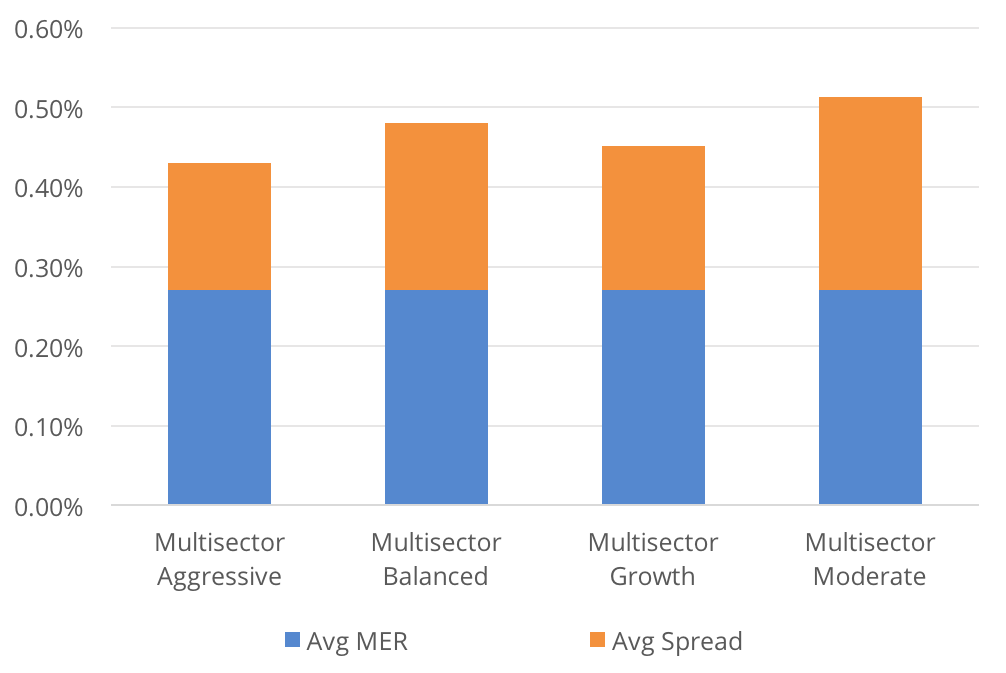
Figure 53: Total Costs |
Figure 54: Performance |
 |
 |
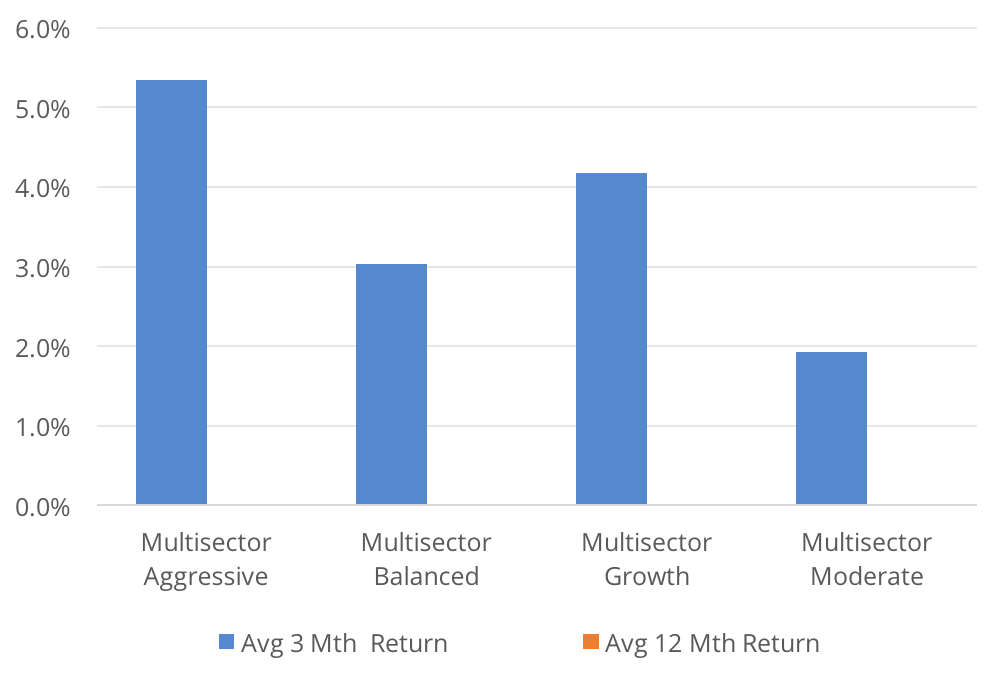 |
Figure 55: Average Annual Volatlity |
|
|
 |
||
with the InvestSMART diversified portfolios
Key Data: Diversified ETFs
Figure 66: Diversified ETFs
| FUM ($m) | Costs | Performance | Income | Categorisation | ||||||||
| Security | Total FUM | Qtr Flows | MER | Avg Spread | Avg Liquidity | 3 Months | 12 Months | Yield | Frequency | Structure | Sub Category | Star Rating |
| GLOBAL | ||||||||||||
| Balanced | ||||||||||||
| [VDBA] Vanguard Diversified Balanced ETF | $23.65 | $11.72 | 0.27% | 0.21% | 23.01% | 3.03% | 0.00% | 0.73% | Quarterly | ETF | Multisector Balanced | 2 |
| Conservative | ||||||||||||
| [VDCO] Vanguard Diversified Conservative ETF | $9.67 | $5.05 | 0.27% | 0.24% | 19.17% | 1.92% | 0.00% | 0.66% | Quarterly | ETF | Multisector Moderate | 2 |
| High Growth | ||||||||||||
| [VDHG] Vanguard Diversified High Growth ETF | $64.92 | $18.07 | 0.27% | 0.16% | 12.47% | 5.34% | 0.00% | 1.62% | Quarterly | ETF | Multisector Aggressive | 4 |
| Growth | ||||||||||||
| [VDGR] Vanguard Diversified Growth ETF | $33.42 | $13.88 | 0.27% | 0.18% | 19.52% | 4.17% | 0.00% | 1.39% | Quarterly | ETF | Multisector Growth | 3 |
Equities
| Total FUM ($m) | Qtr Flows ($m) | No. Funds |
| $ 30,585.00 | $ 685.40 | 126 |
What is also clear from current flows are investors are chasing exposure to the US' economic prosperity. The S&P 500 remains a global bright spot and why we continue to see flows into IVV and InvestSMART’s International Equities Portfolio. One only has to glance at the flows into the USD and USD-denoted ETFs to reach this conclusion; be it equity, fixed income or commodities exposure, flow is moving into all things US, despite geopolitical risk.
Figure 67: Funds Under Management ($M) |
Figure 68: Geographic Exposure |
Figure 69: Flows ($M) |
 |
 |
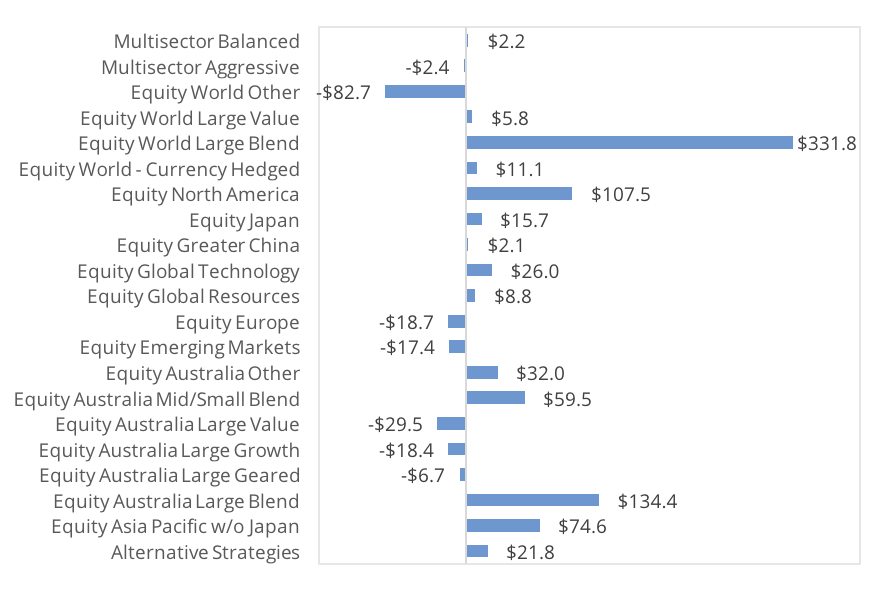 |
Figure 70: Average Yield |
Figure 71: Total Costs |
Figure 72: Performance |
 |
 |
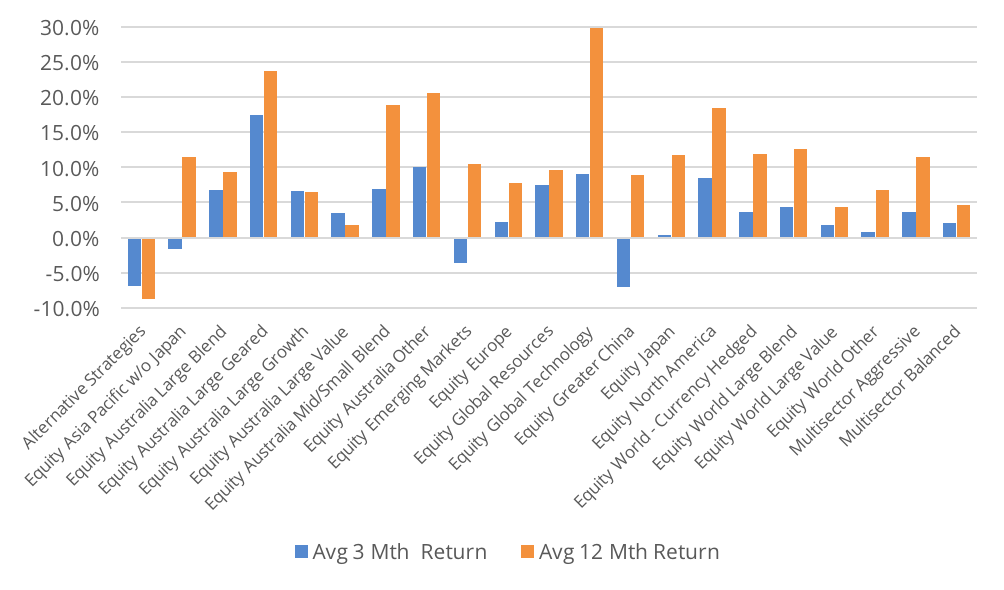 |
Figure 73: Average Annual Volatlity |
|
|
 |
||
We saw generally weak performance across Asia and Emerging Market focused ETFs as China’s two major indices in the Shanghai Composite and Shenzhen Composite fell into bear markets. The reasoning for the collapse in Chinese markets is attributed to the US enacting tariffs on US$50 billion worth of Chinese exports and Beijing ramping up its financial stability programs most notably the debt-to-equity swaps program that impedes return on capital (ROC). Considering the very high valuations in Chinese stocks this impact on ROC impacted overall share value.
It was a mixed bag for flows, with “Equity World Large Blend” seeing strong inflows, again with 50% going to Vanguard, via their MSCI International ETF (VGS) and All-World ex US ETF (VEU) ETFs alone. ‘Equity World Other’ however saw net outflows. This was due in part to iShares decision to close down 5 of their ETFs, IRU, IXP, ISG, IHK & IBK.
Invest in the InvestSMART International Equities Portfolio
Key Data: Equity ETFs
Figure 70: Equity ETFs
| FUM ($m) | Costs | Performance | Income | Categorisation | ||||||||
| Security | Total FUM | Qtr Flows | MER | Avg Spread | Avg Liquidity | 3 Months | 12 Months | Yield | Frequency | Structure | Sub Category | Star Rating |
| EUROPE | ||||||||||||
| Equities - Broad | ||||||||||||
| [ESTX] ETFS EURO STOXX 50 ETF | $65.02 | $(2.02) | 0.35% | 0.16% | 12.09% | 1.67% | 7.74% | 3.74% | Semi-Annual | ETF | Equity Europe | 3 |
| [HEUR] BetaShares WisdomTree Europe ETF - Currency Hedged | $49.64 | $(2.54) | 0.58% | 0.20% | 12.80% | 2.66% | 3.74% | 3.97% | Semi-Annual | ETF | Equity Europe | 3 |
| [IEU] iShares Europe ETF (AU) | $762.46 | $(43.38) | 0.60% | 0.10% | 8.09% | 2.63% | 8.97% | 2.54% | Semi-Annual | ETF | Equity Europe | 4 |
| [VEQ] Vanguard FTSE Europe Shares ETF | $193.63 | $29.22 | 0.35% | 0.15% | 9.41% | 1.81% | 8.49% | 2.58% | Quarterly | ETF | Equity Europe | 4 |
| Equities - Strategy | ||||||||||||
| [UBE] UBS IQ MSCI Europe Ethical ETF | $11.07 | $- | 0.40% | 0.34% | 5.60% | 2.63% | 9.73% | 2.71% | Annual | ETF | Equity Europe | 2 |
| EMERGING MARKETS | ||||||||||||
| Equities - Broad | ||||||||||||
| [IBK] iShares MSCI BRIC ETF (AU) | $36.57 | $(4.10) | 0.72% | 0.47% | 12.20% | -3.31% | 19.48% | 1.24% | Semi-Annual | ETF | Equity Emerging Markets | 2 |
| [IEM] iShares MSCI Emerging Markets ETF (AU) | $615.12 | $(19.15) | 0.69% | 0.12% | 10.97% | -4.48% | 11.60% | 1.84% | Semi-Annual | ETF | Equity Emerging Markets | 4 |
| [VGE] Vanguard FTSE Emerging Markets Shares ETF | $203.95 | $5.84 | 0.48% | 0.20% | 10.22% | -6.30% | 9.20% | 1.77% | Quarterly | ETF | Equity Emerging Markets | 3 |
| [WEMG] SPDR S&P Emerging Markets ETF | $19.55 | $0.00 | 0.65% | 0.24% | 10.47% | -4.10% | 12.13% | 2.50% | Annual | ETF | Equity Emerging Markets | 2 |
| Equities - Strategy | ||||||||||||
| [EMKT] VanEck Vectors MSCI Mltfac Emerging Markets Equities ETF | $3.86 | $- | 0.69% | 0.40% | 47.61% | 0.00% | 0.00% | 0.47% | Annual | ETF | Equity Emerging Markets | 2 |
| USA | ||||||||||||
| Equities - Broad | ||||||||||||
| [IJH] iShares S&P Mid - Capital ETF | $143.27 | $(9.69) | 0.07% | 0.15% | 15.84% | 8.28% | 17.83% | 1.12% | Quarterly | ETF | Equity North America | 4 |
| [IJR] iShares S&P Small - Capital ETF | $165.64 | $38.67 | 0.07% | 0.42% | 10.53% | 12.86% | 25.09% | 0.94% | Quarterly | ETF | Equity North America | 4 |
| [IRU] iShares Russell 2000 ETF (AU) | $72.31 | $(18.36) | 0.20% | 0.21% | 14.30% | 11.85% | 20.48% | 0.94% | Quarterly | ETF | Equity North America | 3 |
| [IVV] iShares S&P 500 ETF | $2,739.08 | $34.17 | 0.04% | 0.07% | 3.41% | 7.38% | 18.71% | 1.50% | Quarterly | ETF | Equity North America | 5 |
| [NDQ] BetaShares NASDAQ 100 ETF | $340.61 | $42.23 | 0.48% | 0.12% | 10.38% | 11.19% | 29.97% | 0.49% | Semi-Annual | ETF | Equity North America | 4 |
| [QUS] BetaShares FTSE RAFI US 1000 ETF | $41.41 | $- | 0.40% | 0.19% | 5.42% | 6.13% | 14.64% | 3.01% | Semi-Annual | ETF | Equity North America | 3 |
| [SPY] SPDR S&P 500 ETF | $21.91 | $1.11 | 0.09% | 0.18% | 4.82% | 7.35% | 18.60% | 1.48% | Quarterly | ETF | Equity North America | 3 |
| [VTS] Vanguard US Total Market Shares ETF | $1,343.71 | $26.63 | 0.04% | 0.07% | 3.66% | 7.87% | 19.21% | 1.37% | Quarterly | ETF | Equity North America | 5 |
| Equities - Strategy | ||||||||||||
| [GGUS] BetaShares Geared US Equities - Currency Hedged | $17.66 | $(1.67) | 0.80% | 0.14% | 50.54% | 6.59% | 24.53% | 0.75% | Annual | MF | Equity World - Currency Hedged | NR |
| [IHVV] iShares S&P 500 AUD Hedged ETF | $107.85 | $(6.34) | 0.10% | 0.13% | 9.35% | 3.37% | 13.70% | 1.62% | Annual | ETF | Equity North America | 4 |
| [UBU] UBS IQ MSCI USA Ethical ETF | $6.79 | $(0.00) | 0.20% | 0.21% | 2.62% | 7.66% | 18.67% | 1.56% | Annual | ETF | Equity North America | 2 |
| [UMAX] BetaShares S&P 500 Yield Maximiser | $93.31 | $(3.66) | 0.79% | 0.20% | 3.49% | 7.65% | 12.53% | 4.42% | Quarterly | MF | Equity World Other | NR |
| [ZYUS] ETFS S&P 500 High Yield Low Volatil ETF | $51.67 | $(1.49) | 0.35% | 0.21% | 6.86% | 8.80% | 8.15% | 5.54% | Quarterly | ETF | Equity North America | 3 |
| [BBUS] BetaShares US Equities Strong Bear Hedged - Currency Hedged | $59.23 | $(0.84) | 1.38% | 0.25% | 32.81% | -7.07% | -28.35% | 0.00% | Annual | MF | Alternative Strategies | NR |
| ASIA | ||||||||||||
| Equities - Broad | ||||||||||||
| [CETF] Market Vectors ChinaAMC A - Share ETF (Syn) | $10.14 | $1.27 | 0.72% | 0.45% | 17.14% | -11.99% | 1.38% | 1.02% | Annual | ETF | Equity Greater China | 2 |
| [HJPN] BetaShares WisdomTree Japan ETF - Currency Hedged | $63.68 | $(6.72) | 0.58% | 0.19% | 11.71% | -1.99% | 6.36% | 2.81% | Semi-Annual | ETF | Equity Japan | 3 |
| [IAA] iShares Asia 50 ETF (AU) | $433.94 | $23.96 | 0.50% | 0.36% | 5.23% | -1.94% | 16.70% | 1.40% | Semi-Annual | ETF | Equity Asia Pacific w/o Japan | 3 |
| [IHK] iShares MSCI Hong Kong ETF (AU) | $14.73 | $(2.15) | 0.48% | 0.62% | 20.87% | 2.49% | 12.88% | 3.51% | Semi-Annual | ETF | Equity World Other | 2 |
| [IJP] iShares MSCI Japan ETF (AU) | $262.71 | $22.40 | 0.48% | 0.13% | 8.63% | 1.52% | 14.34% | 1.21% | Semi-Annual | ETF | Equity Japan | 4 |
| [IKO] iShares MSCI South Korea ETF (AU) | $41.84 | $3.34 | 0.64% | 0.55% | 5.67% | -5.48% | 6.87% | 2.54% | Annual | ETF | Equity World Other | 2 |
| [ISG] iShares MSCI Singapore ETF | $8.62 | $1.54 | 0.48% | 0.50% | 45.49% | -3.93% | 10.10% | 2.76% | Semi-Annual | ETF | Equity World Other | 2 |
| [ITW] iShares MSCI Taiwan ETF | $47.84 | $1.69 | 0.64% | 1.02% | 5.37% | -1.15% | 7.35% | 2.24% | Annual | ETF | Equity World Other | 2 |
| [IZZ] iShares China Large - Capital ETF (AU) | $96.40 | $0.82 | 0.74% | 0.39% | 10.35% | -2.22% | 16.57% | 2.81% | Semi-Annual | ETF | Equity Greater China | 2 |
| [VAE] Vanguard FTSE Asia ex Japan Shares Index ETF | $97.29 | $28.24 | 0.40% | 0.23% | 18.57% | -1.97% | 12.55% | 2.79% | Quarterly | ETF | Equity Asia Pacific w/o Japan | 3 |
| [PAXX] Platinum Asia (Quoted Managed Hedged) | $92.22 | $22.43 | 1.10% | 0.38% | 11.29% | -0.96% | 0.00% | 23.12% | Annual | MF | Equity Asia Pacific w/o Japan | NR |
| Equities - Strategy | ||||||||||||
| [UBJ] UBS IQ MSCI Japan Ethical ETF | $4.55 | $(0.00) | 0.40% | 0.23% | 4.76% | 1.60% | 14.42% | 1.52% | Annual | ETF | Equity Japan | 2 |
| [UBP] UBS IQ MSCI Asia APEX 50 Ethical ETF | $8.94 | $- | 0.45% | 0.34% | 12.00% | -1.51% | 16.67% | 1.03% | Annual | ETF | Equity Asia Pacific w/o Japan | 2 |
| GLOBAL | ||||||||||||
| Equities - Broad | ||||||||||||
| [IHOO] iShares Global 100 AUD Hedged ETF | $36.85 | $- | 0.43% | 0.41% | 4.69% | 4.21% | 11.82% | 5.60% | Annual | ETF | Equity World - Currency Hedged | 2 |
| [IHWL] iShares Core MSCI World All Capital AUDH ETF | $12.03 | $- | 0.19% | 0.42% | 6.90% | 3.72% | 11.71% | 1.52% | Semi-Annual | ETF | Equity World - Currency Hedged | 2 |
| [IOO] iShares Global 100 ETF (AU) | $1,404.20 | $0.48 | 0.40% | 0.12% | 2.40% | 5.98% | 15.90% | 1.87% | Semi-Annual | ETF | Equity World Large Blend | 4 |
| [IVE] iShares MSCI EAFE ETF (AU) | $330.61 | $11.18 | 0.33% | 0.18% | 5.47% | 2.77% | 10.84% | 2.57% | Semi-Annual | ETF | Equity World Large Blend | 4 |
| [IWLD] iShares Core MSCI World All Capital ETF | $29.42 | $5.25 | 0.16% | 0.42% | 7.18% | 5.66% | 15.78% | 2.18% | Semi-Annual | ETF | Equity World Large Blend | 3 |
| [KII] K2 Global Equities Fund (Hedge Fund) | $17.12 | $(0.55) | 2.70% | 1.33% | 4.55% | -0.36% | 9.64% | 0.00% | Quarterly | MF | Alternative Strategies | NR |
| [MGE] Magellan Global Equities | $1,051.31 | $9.37 | 1.35% | 0.39% | 3.43% | 7.40% | 16.89% | 3.03% | Annual | MF | Equity World Large Blend | NR |
| [MHG] Magellan Global Equities Currency Hedged | $67.14 | $2.08 | 1.35% | 0.52% | 3.65% | 4.22% | 12.90% | 4.01% | Annual | MF | Equity World - Currency Hedged | NR |
| [QUAL] VanEck Vectors MSCI World ex Australian Qlty ETF | $381.41 | $16.36 | 0.40% | 0.16% | 6.20% | 5.85% | 18.17% | 1.76% | Annual | ETF | Equity World Large Blend | 4 |
| [UBW] UBS IQ MSCI World ex Australia Ethical ETF | $29.25 | $1.01 | 0.35% | 0.24% | 4.41% | 5.73% | 15.49% | 1.92% | Annual | ETF | Equity World Large Blend | 2 |
| [VEU] Vanguard All - World ex-US Shares ETF | $1,243.27 | $67.35 | 0.11% | 0.11% | 4.57% | 0.40% | 10.83% | 2.49% | Quarterly | ETF | Equity World Large Blend | 4 |
| [VGAD] Vanguard MSCI Index International (Hedged) ETF | $412.89 | $8.46 | 0.21% | 0.09% | 10.01% | 3.72% | 11.40% | 2.01% | Semi-Annual | ETF | Equity World - Currency Hedged | 4 |
| [VGS] Vanguard MSCI Index International ETF | $1,097.48 | $96.71 | 0.18% | 0.07% | 7.29% | 5.62% | 15.42% | 2.39% | Quarterly | ETF | Equity World Large Blend | 4 |
| [WXHG] SPDR S&P World ex Australia (Hedged) ETF | $82.47 | $2.24 | 0.35% | 0.24% | 2.64% | 3.45% | 11.05% | 2.31% | Annual | ETF | Equity World - Currency Hedged | 3 |
| [WXOZ] SPDR S&P World ex Australia ETF | $171.51 | $(1.89) | 0.30% | 0.17% | 1.47% | 5.23% | 15.09% | 2.42% | Annual | ETF | Equity World Large Blend | 3 |
| [PIXX] Platinum International (Quoted Managed Hedged) | $210.87 | $51.96 | 1.10% | 0.32% | 10.03% | -1.88% | 0.00% | 13.05% | Annual | MF | Equity World Large Blend | NR |
| Equities - Sector | ||||||||||||
| [BNKS] BetaShares Global Banks ETF - Currency Hedged | $71.79 | $(0.00) | 0.57% | 0.31% | 10.52% | -4.70% | 2.77% | 3.85% | Semi-Annual | ETF | Equity World Other | 2 |
| [DRUG] BetaShares Global Healthcare ETF - Currency Hedged | $24.55 | $2.23 | 0.57% | 0.34% | 7.74% | 4.24% | 5.57% | 3.59% | Semi-Annual | ETF | Equity World Other | 2 |
| [FOOD] BetaShares Global Agriculture Companies ETF - Currency Hedged | $17.38 | $- | 0.57% | 0.37% | 6.94% | -0.52% | 4.99% | 3.34% | Semi-Annual | ETF | Equity World Other | 2 |
| [FUEL] BetaShares Global Energy Companies ETF - Currency Hedged | $28.87 | $10.40 | 0.57% | 0.37% | 25.31% | 14.11% | 26.83% | 2.18% | Semi-Annual | ETF | Equity Global Resources | 2 |
| [GDX] Market Vectors Gold Miners ETF | $68.89 | $(1.64) | 0.53% | 0.34% | 4.58% | 5.32% | 5.69% | 0.64% | Annual | ETF | Equity Global Resources | 2 |
| [HACK] Betashares Global Cybersecurity ETF | $87.35 | $15.12 | 0.67% | 0.26% | 12.97% | 9.31% | 26.88% | 4.58% | Semi-Annual | ETF | Equity Global Technology | 2 |
| [IXI] iShares Global Consumer Staples ETF (AU) | $107.10 | $(4.21) | 0.47% | 0.28% | 2.98% | 2.94% | 2.11% | 2.04% | Semi-Annual | ETF | Equity World Other | 3 |
| [IXJ] iShares Global Healthcare ETF (AU) | $491.90 | $(16.67) | 0.47% | 0.23% | 2.72% | 6.37% | 8.99% | 1.24% | Semi-Annual | ETF | Equity World Other | 3 |
| [IXP] iShares Global Telecom ETF (AU) | $14.50 | $(64.85) | 0.47% | 0.41% | 182.39% | 0.61% | 0.03% | 3.05% | Semi-Annual | ETF | Equity World Other | 2 |
| [MNRS] BetaShares Global Gold Miners ETF - Currency Hedged | $5.08 | $- | 0.57% | 0.61% | 16.40% | 3.14% | -3.48% | 0.00% | Semi-Annual | ETF | Equity Global Resources | 1 |
| [ROBO] ETFS ROBO Global Robotics and Atmtn ETF | $103.66 | $28.13 | 0.69% | 0.19% | 15.44% | 0.10% | 0.00% | 1.76% | Annual | ETF | Equity World Mid/Small | 3 |
| Equities - Strategy | ||||||||||||
| [DMKT] AMP Capital - Dynamic Markets ETF (Hedge) | $28.85 | $1.30 | 0.50% | 0.70% | 3.58% | 2.65% | 5.25% | 2.80% | Semi-Annual | MF | Multisector Balanced | NR |
| [ETHI] BetaShares Global Sstnbty Leaders ETF | $210.02 | $27.57 | 0.59% | 0.22% | 8.16% | 6.73% | 21.34% | 1.78% | Semi-Annual | ETF | Equity World Large Blend | 3 |
| [GROW] Schroder Real Return ETF | $47.15 | $0.86 | 0.90% | 0.57% | 3.66% | 1.49% | 3.91% | 3.39% | Semi-Annual | MF | Multisector Balanced | NR |
| [MOAT] Market Vectors Morningstar Wide Moat ETF | $58.90 | $0.59 | 0.49% | 0.28% | 3.48% | 9.13% | 15.58% | 0.83% | Annual | ETF | Equity North America | 3 |
| [QMIX] SPDR MSCI World Quality Mix | $8.44 | $0.00 | 0.40% | 0.26% | 4.37% | 5.10% | 15.33% | 2.52% | Semi-Annual | ETF | Equity World Large Blend | 2 |
| [TECH] ETFS Morningstar Global Technology ETF | $57.67 | $10.87 | 0.45% | 0.21% | 14.22% | 8.72% | 32.85% | 5.46% | Semi-Annual | ETF | Equity Global Technology | 3 |
| [WDIV] SPDR S&P Global Dividend ETF | $169.86 | $5.79 | 0.50% | 0.20% | 4.59% | 3.46% | 8.63% | 8.04% | Semi-Annual | ETF | Equity World Large Value | 3 |
| [WDMF] iShares Edge MSCI World Multifactor ETF | $70.99 | $41.09 | 0.35% | 0.32% | 27.86% | 3.19% | 18.10% | 3.06% | Semi-Annual | ETF | Equity World Large Blend | 3 |
| [WRLD] BetaShares Managed Risk Global Share | $28.82 | $(2.37) | 0.54% | 0.29% | 13.06% | 3.66% | 11.40% | 1.53% | Annual | MF | Multisector Aggressive | NR |
| [WVOL] iShares Edge MSCI World Minimum Volume ETF | $10.51 | $0.00 | 0.30% | 0.69% | 28.88% | 5.63% | 11.82% | 4.23% | Semi-Annual | ETF | Equity World Large Blend | 2 |
| [MOGL] Montgomery Global Equities (Managed Fd) | $81.28 | $5.40 | 1.32% | 0.49% | 5.73% | 7.29% | 0.00% | 2.44% | Semi-Annual | MF | Equity World Large Blend | NR |
| [ESGI] VanEck Vectors MSCI International Sustainability Equities ETF | $4.17 | $- | 0.55% | 0.28% | 33.46% | 0.00% | 0.00% | 0.48% | Annual | ETF | Equity World Large Blend | 2 |
| [VMIN] Vanguard Global Minimum Volatil Act ETF | $2.07 | $- | 0.28% | 0.33% | 22.41% | 0.00% | 0.00% | 0.00% | Quarterly | MF | Equity World - Currency Hedged | NR |
| [VVLU] Vanguard Global Value Equity Active ETF | $6.31 | $- | 0.28% | 0.40% | 73.88% | 0.00% | 0.00% | 4.69% | Quarterly | MF | Equity World Large Value | NR |
| AUSTRALIA | ||||||||||||
| Equities - Broad | ||||||||||||
| [EX20] BetaShares Australian ex-20 Portfolio Diversified ETF | $36.60 | $8.96 | 0.25% | 0.18% | 14.55% | 6.44% | 15.62% | 4.27% | Semi-Annual | ETF | Equity Australia Large Blend | 3 |
| [ILC] iShares S&P/ASX 20 ETF | $319.35 | $(12.10) | 0.24% | 0.09% | 6.46% | 9.00% | 11.04% | 4.50% | Quarterly | ETF | Equity Australia Large Blend | 4 |
| [IOZ] iShares Core S&P/ASX 200 ETF | $1,164.06 | $(176.30) | 0.15% | 0.06% | 12.85% | 8.42% | 12.80% | 3.67% | Quarterly | ETF | Equity Australia Large Blend | 5 |
| [ISO] iShares S&P/ASX Small Ordinaries ETF | $106.05 | $17.03 | 0.55% | 0.31% | 9.47% | 7.52% | 23.31% | 1.73% | Semi-Annual | ETF | Equity Australia Mid/Small Blend | 3 |
| [MVE] VanEck Vectors S&P/ASX MidCap ETF | $88.82 | $16.74 | 0.45% | 0.13% | 9.56% | 5.11% | 12.00% | 2.30% | Semi-Annual | ETF | Equity Australia Mid/Small Blend | 3 |
| [MVS] VanEck Vectors Small Companies Masters ETF | $70.48 | $(2.47) | 0.49% | 0.22% | 6.50% | 8.41% | 18.53% | 3.16% | Semi-Annual | ETF | Equity Australia Mid/Small Blend | 3 |
| [MVW] VanEck Vectors Australian Equal Wt ETF | $524.03 | $46.39 | 0.35% | 0.08% | 7.86% | 6.57% | 12.86% | 2.69% | Semi-Annual | ETF | Equity Australia Large Blend | 4 |
| [QOZ] BetaShares FTSE RAFI Australia 200 ETF | $289.17 | $12.63 | 0.40% | 0.12% | 7.42% | 7.45% | 12.14% | 5.90% | Semi-Annual | ETF | Equity Australia Large Blend | 4 |
| [SFY] SPDR S&P/ASX 50 ETF | $514.99 | $5.96 | 0.29% | 0.06% | 3.18% | 8.88% | 11.45% | 4.45% | Quarterly | ETF | Equity Australia Large Blend | 4 |
| [SSO] SPDR S&P/ASX Small Ordinaries ETF | $21.62 | $1.53 | 0.50% | 0.21% | 3.64% | 7.51% | 23.60% | 2.17% | Semi-Annual | ETF | Equity Australia Mid/Small Blend | 2 |
| [STW] SPDR S&P/ASX 200 ETF | $3,794.12 | $(22.94) | 0.19% | 0.04% | 5.67% | 8.41% | 12.88% | 3.90% | Quarterly | ETF | Equity Australia Large Blend | 5 |
| [VAS] Vanguard Australian Shares ETF | $2,834.01 | $110.68 | 0.14% | 0.04% | 5.66% | 8.33% | 13.12% | 4.23% | Quarterly | ETF | Equity Australia Large Blend | 5 |
| [VLC] Vanguard MSCI Australian Large Companies ETF | $83.68 | $0.04 | 0.20% | 0.07% | 2.95% | 8.65% | 10.57% | 4.18% | Quarterly | ETF | Equity Australia Large Blend | 4 |
| [VSO] Vanguard MSCI Australian Small Companies ETF | $189.31 | $25.16 | 0.30% | 0.11% | 8.86% | 6.60% | 18.96% | 1.95% | Semi-Annual | ETF | Equity Australia Mid/Small Blend | 3 |
| [ZOZI] ETFS S&P/ASX 100 ETF | $9.47 | $0.55 | 0.24% | 0.17% | 16.09% | 8.27% | 11.71% | 3.37% | Quarterly | ETF | Equity Australia Large Blend | 3 |
| [A200] BetaShares Australia 200 ETF | $49.64 | $47.89 | 0.07% | 0.04% | 45.87% | 0.00% | 0.00% | 0.20% | Quarterly | ETF | Equity Australia Large Blend | 4 |
| Equities - Sector | ||||||||||||
| [MVB] VanEck Vectors Australian Banks ETF | $35.45 | $4.40 | 0.28% | 0.10% | 14.73% | 6.77% | 5.98% | 2.91% | Tri-Annual | ETF | Equity Australia Other | 3 |
| [MVR] VanEck Vectors Australian Resources ETF | $96.84 | $3.99 | 0.35% | 0.20% | 2.99% | 13.61% | 37.21% | 2.23% | Semi-Annual | ETF | Equity Australia Other | 3 |
| [OZF] SPDR S&P/ASX 200 Financials EX A-REIT ETF | $62.91 | $2.01 | 0.40% | 0.12% | 4.65% | 3.99% | -1.26% | 4.75% | Semi-Annual | ETF | Equity Australia Other | 3 |
| [OZR] SPDR S&P/ASX 200 Resources ETF | $73.44 | $5.47 | 0.40% | 0.16% | 9.14% | 16.08% | 40.02% | 2.17% | Semi-Annual | ETF | Equity Australia Other | 3 |
| [QFN] BetaShares S&P/ASX200 Financials Sect ETF | $22.26 | $7.67 | 0.39% | 0.14% | 21.82% | 3.94% | 1.21% | 4.22% | Semi-Annual | ETF | Equity Australia Other | 3 |
| [QRE] BetaShares S&P/ASX200 Res Sect ETF | $147.77 | $8.43 | 0.39% | 0.23% | 29.20% | 16.22% | 40.14% | 1.16% | Semi-Annual | ETF | Equity Australia Other | 3 |
| Equities - Strategy | ||||||||||||
| [AUMF] iShares Edge MSCI Australia Multifactor ETF | $9.55 | $1.14 | 0.30% | 0.26% | 4.71% | 7.92% | 15.23% | 6.46% | Semi-Annual | ETF | Equity Australia Large Blend | 2 |
| [AUST] BetaShares Managed Risk Australian Share | $21.71 | $(4.97) | 0.49% | 0.12% | 10.87% | 7.03% | 10.20% | 4.41% | Semi-Annual | MF | Equity Australia Large Blend | NR |
| [BBOZ] BetaShares Australian Equities Strong BearHdg | $89.25 | $22.02 | 1.38% | 0.13% | 40.91% | -17.42% | -23.41% | 0.00% | Annual | MF | Alternative Strategies | NR |
| [BEAR] BetaShares Australian Equities Bear Hedge | $51.20 | $1.31 | 1.38% | 0.13% | 18.68% | -7.76% | -10.28% | 0.00% | Annual | MF | Alternative Strategies | NR |
| [DIV] UBS IQ Morningstar Australia Diversified Yield ETF | $11.12 | $(15.66) | 0.30% | 0.24% | 49.86% | 6.03% | 5.55% | 5.47% | Quarterly | ETF | Equity Australia Large Growth | 2 |
| [ETF] UBS IQ Morningstar Australia Quality ETF | $8.37 | $- | 0.30% | 0.13% | 2.26% | 3.92% | 4.49% | 3.06% | Semi-Annual | ETF | Equity Australia Large Blend | 3 |
| [FDIV] VanEck Vectors S&P/ASX Franked Diversified ETF | $3.91 | $0.01 | 0.35% | 0.17% | 5.63% | 7.56% | 8.84% | 4.73% | Quarterly | ETF | Equity Australia Large Blend | 3 |
| [GEAR] BetaShares Geared Australian Equity (Hedged) | $75.23 | $(6.75) | 0.80% | 0.15% | 21.96% | 17.43% | 23.77% | 6.68% | Semi-Annual | MF | Equity Australia Large Geared | NR |
| [IHD] iShares S&P/ASX Dividend Opportunities ETF | $257.47 | $(8.09) | 0.30% | 0.13% | 3.79% | 6.59% | 5.70% | 4.97% | Quarterly | ETF | Equity Australia Large Value | 4 |
| [MVOL] iShares Edge MSCI Australia Mini Volume ETF | $2.28 | $(4.56) | 0.30% | 0.16% | 3.02% | 7.92% | 10.11% | 6.53% | Semi-Annual | ETF | Equity Australia Large Blend | 3 |
| [RARI] Russell Investment Australian Responsible Investment ETF | $70.74 | $(0.02) | 0.45% | 0.27% | 5.29% | 6.90% | 8.94% | 5.92% | Semi-Annual | ETF | Equity Australia Large Value | 3 |
| [RDV] Russell Investment High Dividend Australian Shares ETF | $281.66 | $(3.71) | 0.34% | 0.11% | 3.28% | 2.59% | 4.20% | 6.59% | Quarterly | ETF | Equity Australia Large Value | 4 |
| [RVL] Russell Investment Australian Value ETF | $13.07 | $- | 0.34% | 0.13% | 15.35% | -4.12% | -4.72% | 4.58% | Semi-Annual | ETF | Equity Australia Large Value | 2 |
| [SMLL] BetaShares Australian Small Companies Select | $22.40 | $1.49 | 0.39% | 0.49% | 8.30% | 6.06% | 16.47% | 4.70% | Semi-Annual | MF | Equity Australia Mid/Small Blend | NR |
| [SWTZ] Switzer Dividend Growth | $77.48 | $(2.70) | 0.89% | 0.57% | 3.80% | 7.15% | 7.33% | 3.67% | Quarterly | MF | Equity Australia Large Growth | NR |
| [SYI] SPDR MSCI Australia Select High Diversified Yield ETF | $164.32 | $(23.15) | 0.35% | 0.10% | 5.01% | 6.23% | 4.98% | 5.05% | Quarterly | ETF | Equity Australia Large Value | 4 |
| [UBA] UBS IQ MSCI Australia Ethical ETF | $204.60 | $13.07 | 0.17% | 0.12% | 3.49% | 9.22% | 12.85% | 3.95% | Semi-Annual | ETF | Equity Australia Large Blend | 4 |
| [VHY] Vanguard Australian Shares High Yield ETF | $1,075.50 | $28.48 | 0.25% | 0.05% | 5.23% | 4.50% | 2.63% | n/a | Quarterly | ETF | Equity Australia Large Blend | 4 |
| [YMAX] BetaShares Australian Top 20 Equities Yield Maxmsr | $373.95 | $(22.49) | 0.79% | 0.17% | 6.63% | 5.89% | 8.19% | 8.54% | Quarterly | MF | Equity Australia Large Blend | NR |
| [ZYAU] ETFS S&P/ASX 300 High Yield Plus ETF | $63.53 | $9.64 | 0.35% | 0.16% | 14.68% | 6.84% | 10.06% | 5.00% | Quarterly | ETF | Equity Australia Large Blend | 3 |
| [HVST] BetaShares Australian Diversified Harvester (mgd) | $199.08 | $(17.01) | 0.90% | 0.12% | 8.82% | 6.31% | -4.79% | 10.96% | Monthly | MF | Equity Australia Large Value | NR |
| [KSM] K2 Australian Small Capital Fund | $14.00 | $(0.17) | 2.70% | 1.38% | 5.63% | -2.14% | 8.46% | 6.64% | Annual | MF | Alternative Strategies | NR |
| [FAIR] BetaShares Australian Sustnby Leaders ETF | $164.18 | $58.10 | 0.49% | 0.17% | 17.16% | 6.60% | 0.00% | 1.19% | Semi-Annual | ETF | Equity Australia Large Blend | 4 |
| [EINC] BetaShares Legg Mason Equity Income Fund | $12.89 | $5.36 | 0.85% | 0.36% | 17.71% | 3.27% | 0.00% | 0.94% | Quarterly | MF | Equity Australia Large Value | NR |
| [EIGA] eInvest Income Generator ETF | $17.74 | $17.11 | 0.80% | 0.60% | 9.06% | 0.00% | 0.00% | 0.00% | 0.00% | MF | Equity Australia Large Value | NR |
| [INIF] InvestSMART Australian Equity Income ETF | $34.25 | $34.25 | 1.24% | 0.46% | 11.00% | 0.00% | 0.00% | 0.00% | Semi-Annual | MF | Equity Australia Large Blend | NR |
Glossary
Bid-offer spread: is the bid o er spread is the diference between the highest price that a buyer is willing to pay and the lowest price a seller is willing to sell at.
Commodity: A raw material or primary agricultural product that can be bought and sold.
Currency Hedging: is a risk management technique companies can use to hedge their foreign exchange risk usually using forward contracts and options.
Derivative: A derivative is a contract that derives its value from an underlying asset.
Diversifed: Diversification is a way of managing risk by investing in a variety of lowly correlated securities.
Domicile: The legal home country of a company.
Equal Weighted: Means that each stock is given the same weight in a portfolio.
ETF: An ETF is an investment fund that is traded on a stock exchange, tracking an index.
Floating rate securities: An investment with variable interest payments based on a floating rate.
Flows: The amount of money coming into or out of a fund.
Fully replicating: An ETF that tracks the benchmark index by holding all the stocks in the index.
Funds under Management (FUM): The market value of the assets which a fund manages on behalf of investors.
Hidden liquidity: Refers to the stock of units held by the Market Makers. Their job is to ensure suficient liquidity is available during market hours around the ETFs NAV. It is referred to as ‘hidden’ as they will tend to only place volume on the screen as required.
Leverage: Using debt to finance assets.
Liquidity: Describes the degree to which an asset or security can be quickly bought or sold in the market without affecting the asset’s price.
Managed Funds (MF): If you invest in a managed fund your money, along with those of other investors will be collectively invested by an investment team in various assets.
Management Expense Ratio (MER): A fee charged to the assets of a fund used to pay for the costs of running the fund.
Market Capitalisation: The number of shares outstanding multiplied by the share price
Multisector aggressive: Funds that invest in a number of sectors and are heavily weighted towards growth assets
Multi sector asset allocation: Funds that invest across a number of sectors.
On screen liquidity: Simply refers to the publicly quoted bid and offers you see when you look at a trading screen.
Optimised/partially replicating: As opposed for fully replicating, partially replicating ETFs track the benchmark index without holding all the stocks in the index.
PDS: Product disclosure statement is a document, or sometimes a group of documents, that contains information about a financial product including any significant benefits and risks, the cost of the financial product and the fees and charges that the nancial product issuer may receive.
Prospectus: A Prospectus is a formal legal document that is issued upon on listing on an exchange. It outlines how the raised money will be used and should contain all the information required for investors to make an informed decision.
Security: A tradeable financial asset.
Separately Managed Account (SMA): An SMA is an investment account managed to a model portfolio that is controlled by a portfolio manager. Unlike a managed fund, an SMA is not a pooled investment, everyone’s funds are not in the same bucket. You have your own account and you are the beneficial owner of the stocks held in that account.
Spread: The difference between the price at which someone is willing to buy a security and the price at which someone is willing to sell a security.
Star Rating: InvestSMART’s star rating is a measure of key quantifiable metrics for ETFs: size, fees, liquidity, spread, tracking error.
Structured Products (SP): This refers to a security or derivative which gives financial exposure to the performance of an underlying instrument. Types of structured products include Exchange Traded Commodities (ETCs) and Exchange Traded Notes (ETNs).
Tracking difference: The difference in returns of ETF to its Benchmark for a given period
Tracking error: Refers to the volatility of the tracking difference
Underlying liquidity: Refers to the liquidity in the underlying market that the ETF is designed to track. Underlying liquidity is the most important measure of liquidity when reviewing an ETF. You will find that the less liquid the underlying index, the wider the on-market bid-ask spread tends to be to account for the transactional costs involved in dealing.
Yield: The income return on an investment, such as interest or dividends received from holding it. Yield is usually expressed as an annual percentage rate.


Frequently Asked Questions about this Article…
The InvestSMART Australian Equity Income Fund (ASX:INIF) is an active ETF launched by InvestSMART in June 2018. It aims to provide attractive risk-adjusted returns over the medium to long-term while reducing the risk of permanent capital loss. The fund offers exposure to a concentrated portfolio of well-researched Australian equities with a sustainable high yield.
The InvestSMART Star Rating system is a quantitative 5-star rating system that evaluates ETFs based on key metrics such as size, fees, liquidity, spread, and tracking error. It serves as a filtering tool to compare ETFs with similar objectives but does not constitute investment recommendations.
ETFs are passive funds that track an index, while Active ETFs are actively managed to outperform a benchmark. LICs are closed-ended companies that can retain or pay dividends, and mFunds are unlisted managed funds available via the ASX, allowing investors to trade units like shares.
ETFs offer a low-cost, hassle-free way to achieve investment objectives. They provide diversification, transparency, and the ability to buy directly on the market, making them popular among investors seeking exposure to specific investment themes or asset classes.
InvestSMART categorizes the ETP market by asset class, including Commodities, Currency, Diversified, Equities, Fixed Income & Cash, and Property & Infrastructure. This categorization helps investors quickly identify suitable securities to fill investment gaps and align with their objectives.
The purpose of the InvestSMART June Quarter 2018 ETP report is to provide clients with an easy-to-digest overview of market activity and insights into the construction of InvestSMART's Separately Managed Account (SMA) portfolios, which are based on ETFs.
Key features of the InvestSMART Australian Equity Income Fund (ASX:INIF) include a semi-annual distribution frequency, a management fee of 0.97% (incl. GST), a suggested investment timeframe of 5 years, and a portfolio dividend yield of 3.8% net and 4.8% gross as of June 30, 2018.
The InvestSMART Star Rating helps investors quickly assess ETFs based on quantifiable metrics like size, fees, liquidity, spread, and tracking error. A 4 to 5-star rating indicates strong performance across these metrics, aiding investors in making informed decisions.


