InvestSMART Australian Exchange-Traded Fund Quarterly Report - December 2017


About this report
Highlights
Market Overview
Securities Overview
About this report
Welcome to InvestSMART’s December Quarter 2017 Australian Exchange-Traded Funds (ETF) update.
ETFs are the basis of InvestSMART’s Separately Managed Account (SMA) portfolios. The purpose of this report is to provide our clients with an easy to digest wrap of market activity as well as a greater level of insight into how and why we’ve built our SMA portfolios the way we have.
ETFs are a low-cost, hassle-free way for investors to achieve their investment objectives. Whether your aim is to diversify your portfolio or to obtain exposure to a particular asset class or investment theme, the ability to buy ETFs directly on the market, their low cost and transparency has seen the popularity of these securities amongst investors grow rapidly.
We have categorised the ETF market by asset class to allow members to quickly identify suitable securities to fill any investment gaps in their portfolio and remain aligned to their specific investment objectives.
Figure 1: Asset Classes
| Asset Class | Description |
|---|---|
| Commodities | Exchange Traded Funds (ETFs) that provide exposure to various Commodities & Natural Resources. |
| Currency | Exchange Traded Funds (ETFs) that provide exposure to various Currencies. |
| Diversified | Exchange Traded Funds (ETFs) that provide Diversified Multi Sector exposure |
| Equities | Exchange Traded Funds (ETFs) that provide exposure to Equity Markets. |
| Fixed Income & Cash | Exchange Traded Funds (ETFs) that provide exposure to Interest Rate securities and Cash. |
| Property & Infrastructure | Exchange Traded Funds (ETFs) that provide exposure to Domestic and Global Property and Infrastructure. |
About InvestSMART
Founded in 1999, InvestSMART Group Limited (ASX:INV) believes everyone should have the confidence to control their financial future and it shouldn’t be hard or expensive to do so.
Whether you’re managing your own investments or looking for a little help, we deliver straightforward, flexible and affordable solutions to ensure you are better able to meet your investment goals.
Our three leading brands – InvestSMART, Eureka Report and Intelligent Investor – together offer actionable investment tools, wealth advice and independent ASX-listed stock research.
We’re all about making investing simple. Statistics show four in five Australians do not receive any professional investment advice, with cost the primary reason. We aim to change that.
Through our Portfolio Manager, stock research, wealth commentary and affordable investment products, we believe we are delivering the right tools to help all Australians grow and protect their wealth.
InvestSMART Star Rating
When reviewing an ETF there are some key metrics common to every security. Our quantitative 5 Star Rating System takes each of these items into account, reflecting the process we use to identify investments in InvestSMART’s ETF-based Portfolios.
We have categorised the ETF market by asset class to allow members to quickly identify suitable securities to fill any investment gaps in their portfolio and remain aligned to their specific investment objectives.
Figure 2: InvestSMART Star Rating Criteria
| Factor | Description |
|---|---|
| Size | Funds under management. |
| Fees | Fund management fees as a percentage of FUM. |
| Liquidity | Trading volumes. |
| Spread | The average percentage difference between the bid & ask. |
| Tracking error | The difference in the return profile of the Fund to its benchmark. |
For our portfolios, we generally like to see a 4 to 5-star rating. This implies the security rates highly across each of the above-mentioned metrics. However, the star rating is best used as a filtering tool when comparing ETFs with the same objective.
It does not make sense to compare a highly liquid, and hence low-cost S&P 500 ETF, to one designed to track the performance of emerging markets, which are often less liquid and more expensive to access.
As the table below shows, only eight Australian ETFs out of the total of 173 listed funds achieve the maximum 5 Star Rating. The bulk of ETFs are rated 3 Stars or less.
It should also be noted that the InvestSMART Star Rating is a quantitative measure and it does not take personal investment objectives into account. It does not constitute a recommendation.
Figure 3: Number of ETFs per star rating
| Star Rating | Number of ETFs |
|---|---|
 5 5 |
8 |
| 4 |
36 |
| 3 |
61 |
| 2 |
52 |
| 1 |
2 |
| NA | 2 |
So which ETF is best?
Following our September Quarter ETF report, we had a lot of members asking, “but which ETF is best?”
Determining this is not as simple as looking at a funds performance. As ETFs are passively managed and are constructed to track a given benchmark the performance of an ETF over any given period does not generally indicate it is better or worse than. Rather, it is simply reflective of the performance of the asset class or sector the ETF has been designed to track.
With this in mind, in order to determine which ETF is best for you, an investor must firstly understand how their portfolio is currently positioned. With over 60,000 self-directed investors utilising InvestSMARTs Portfolio Manager, we gather unique insights into the behaviour of a large proportion of Australia’s investing public.
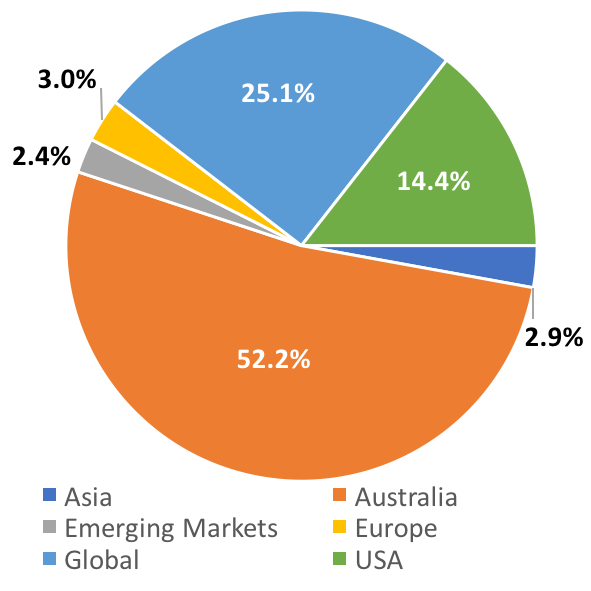
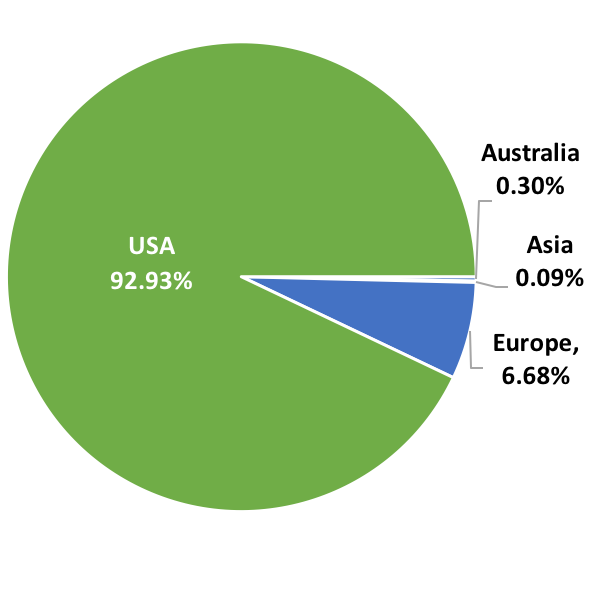
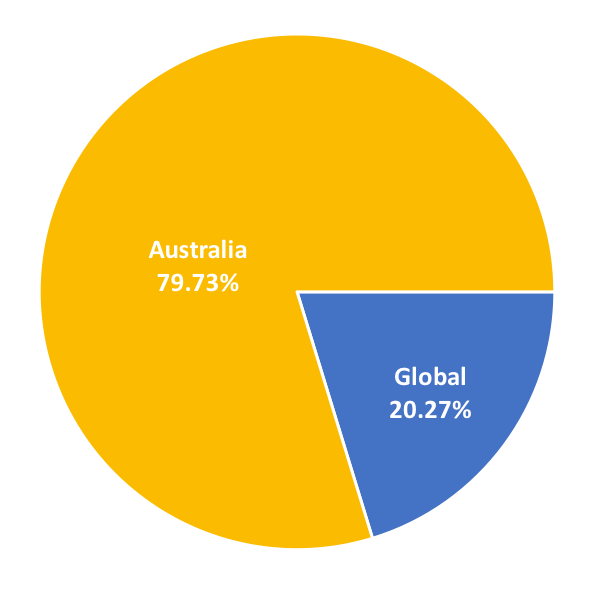
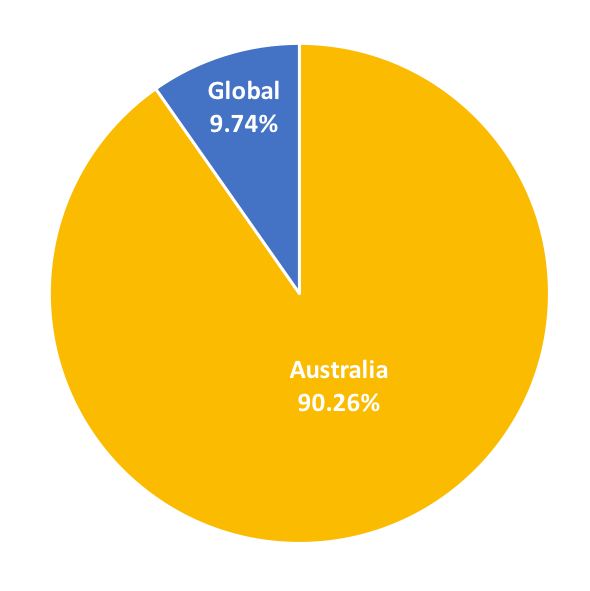
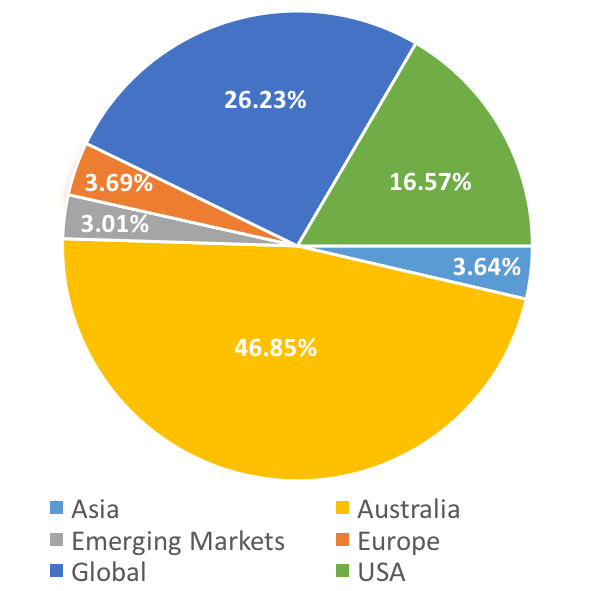
We reviewed the average asset allocation of portfolios and found that most Australians wealth is invested in domestic equities.
Figure 4: Average asset allocation for portfolio sub $250k - 31 December 2017
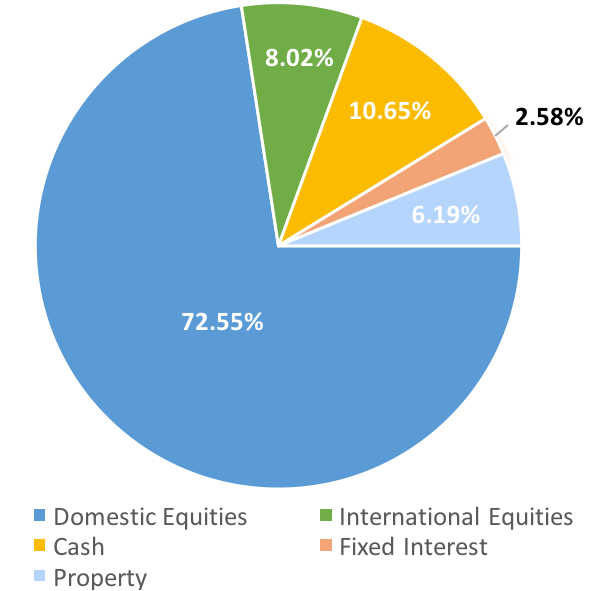
Source: Information has been collated from de-identified data through InvestSMART’s Portfolio Manager and HealthCheckTM Comparison has been made to a model asset allocation as determined by InvestSMART Group.
We recognise that over the long term no one asset class is guaranteed to deliver substantial outperformance on a consistent basis and that attempting to time turning points across various asset classes is near impossible.
As such, our view on portfolio construction is based on the concept of diversification. Via InvestSMART's Health Check we assist our clients in understanding how their portfolio is currently positioned and whether it is appropriate in achieving their objectives.
If we take the above to be an indication of the ‘average’ Australian portfolio and decided a ‘balanced portfolio’ would be best suited in achieving our investment objective, we’d see that we are overweight domestic equities and would determine the following:
Figure 5: Balanced Asset Allocation
| Asset Class | Current Portfolio | Balanced Portfolio | Required Action |
|---|---|---|---|
| Australian Equities | 72% | 22% | Reduce by 50% |
| International Equities | 8% | 22% | Increase by 14% |
| Property | 6% | 11% | Increase by 5% |
| Cash | 11% | 12% | Increase by 1% |
| Fixed Interest | 3% | 33% | Increase by 30% |
Source: Information has been collated from de-identified data through InvestSMART’s Portfolio Manager and HealthCheckTM Comparison has been made to a model asset allocation as determined by InvestSMART Group.
What is ‘best’ for this particular portfolio therefore would be to diversify by re-investing a portion of Equity exposure across Fixed Interest and International Equities. We could then filter through the ETF market to find securities worthy of more detailed analysis. This can be achieved using InvestSMARTs ETF Filtering Tool.
For the Fixed interest component, should we decide we would like Australian Bond Exposure only. To identify these securities we could search for, Asset Class: Fixed income and Cash > Geographic Exposure: Australia > Category: Bonds – Australia.
Figure 6: Australian Fixed Income and Cash ETFs
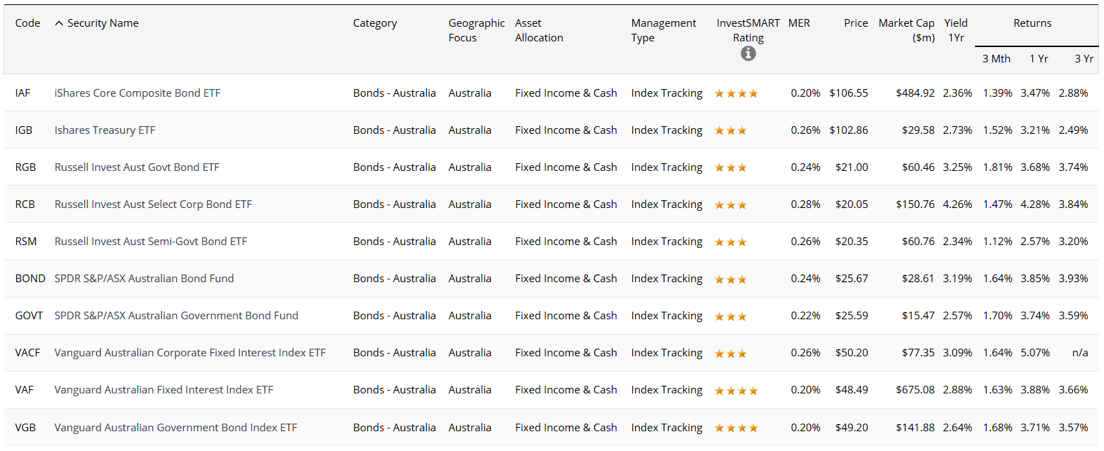
Source: InvestSMART ETF Filtering Tool.
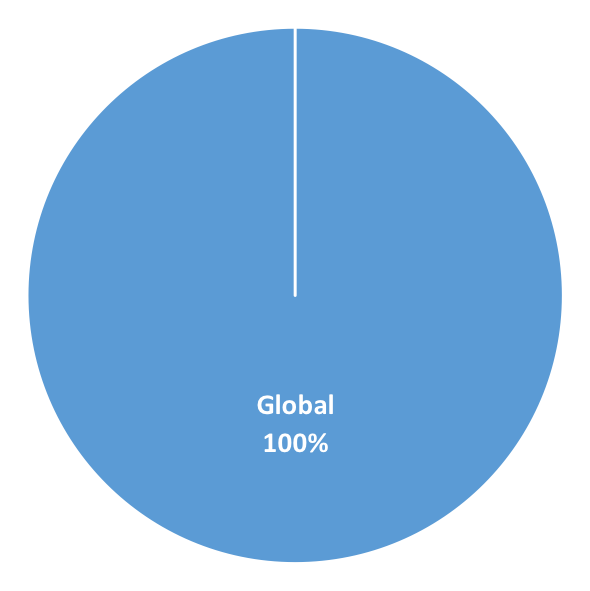
For the International Equities component, should we decide we would like to focus on large cap, global, broad-based securities. To identify these securities we could search for, Asset Class: Equities > Geographic Exposure: Global > Category: Equity World Large Blend.
Figure 7: Global Equity ETFs
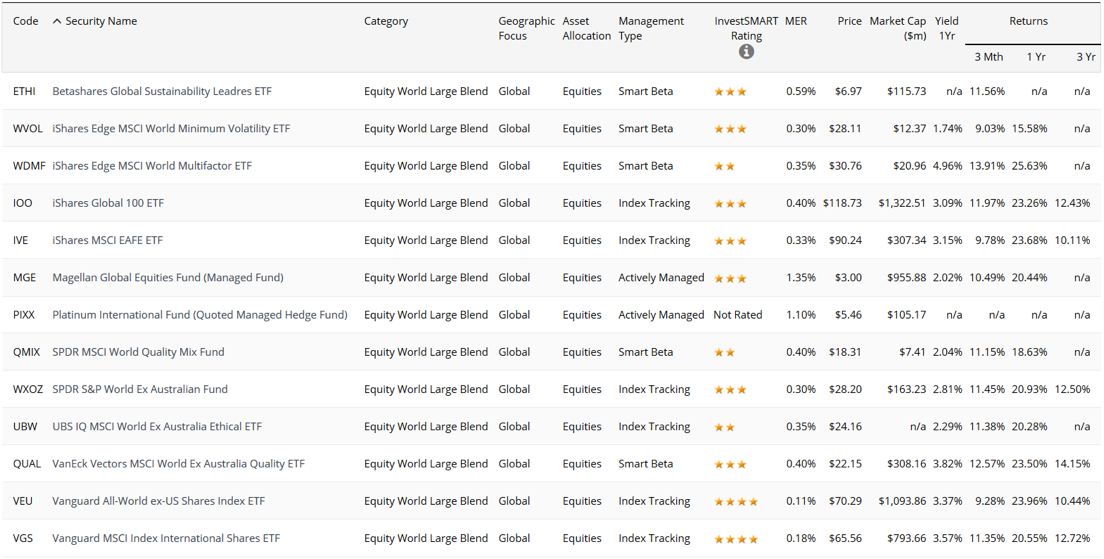
Source: InvestSMART ETF Filtering Tool
After narrowing down the list, we can then conduct further due diligence to determine which security best suits our needs. We will explore the due diligence process next quarter.
| Step 1 | Step 2 | Step 3 | Step 4 |
|---|---|---|---|
| Portfolio Manager | InvestSMART HealthCheck ™ | InvestSMART ETF Filter | Due Diligence |
| Load your current holdings into the InvestSMART's Portfolio Manager | Determine your investment objectives and identify where the holes exist in your Asset Allocation | Use InvestSMART's ETF Filtering tool to identify ETFs that will provide exposure you need | Review each ETF in greater detail to determine whether it suits your objectives |
with the InvestSMART Portfolio Manager
The Active vs Passive Debate
As the ETF market grows, there is growing debate surrounding what is better, passive or active investment.
We don’t believe it is a simple black or white consideration. Perhaps to actively engaged investors the concept of a passive fund seems illogical. “Why would I want to invest in something that guarantees benchmark returns?”.
However, for the average person who does not have the time or skill to invest themselves or identify a manager that will ensure they consistently outperform over an extended period, passive strategies could be suitable. Even Warren Buffett has stated that for most investors the best option is to put their money in a low-cost index fund.
Passive investing has its place in building the core of a well-diversified portfolio. Where fees are justified by way of consistent long-term performance, active strategies also have a place within a portfolio in generating alpha (the excess return of an investment relative to the return of a benchmark index).
Figure 8: Passive vs Active Strategies
| Where an allocation to passive strategies is suitable | Where an allocation to active strategies is suitable |
|---|---|
| 'Generic' markets where mispricing is uncommon | Markets where mispricing exists |
| As the core building blocks to a diversified portfolio | Where a manager shows history of consistent outperformance |
| For investors who lack the time or skill to time markets |
Coming back to ETFs and contrary to common belief, no longer are all listed funds simple passive market cap weighted, index hugging securities and there is a growing number of actively managed funds coming to. That is, actively managed funds that you can buy or sell in the same way as any security on the market. These securities are being generally referred to as Exchange Quoted Managed Funds (EQMF) or Exchange Traded Managed Funds (ETMF). Similar to mFunds but actively quoted not just settled on ASX systems.
This growing category of listed fund allows investors to allocate capital toward active managed strategies without the hassle of filling out additional paperwork and with the benefit of knowing the price at which you will be buying or selling units at the time of transaction.
Figure 9: Benefits of a listed fund
| Listed: Benefits to Investors | Listed: Benefits to Fund Managers |
|---|---|
| No minimum investment barriers | Open ended |
| Ability to buy & sell as easily as any other listed security | Reduced paperwork |
| Pricing transparency | Available on platforms/wrap accounts |
| Intra day pricing rather than end-of-day | Distribute to direct investor |
At present there are 14 actively managed funds listed on the exchange with varying mandates, from those that focus on yield, to small caps, to international equity markets. 2017 saw 5 new actively managed funds come to market and we see this becoming an increasingly common way for fund managers to structure their funds.
Figure 10: Exchange Quoted Managed Funds.
| Code | Name | Region | Asset Class | Sub Category | MER | Spread | Total Cost | FUM ($m) |
|---|---|---|---|---|---|---|---|---|
| Asia | ||||||||
| PAXX | Platinum Asia Fund | Asia | Equities | Equity Asia Pacific w/o Japan | 1.10% | n/a | 1.10% | 69.79 |
| Australia | ||||||||
| KSM | K2 Australian Small Cap Fund | Australia | Equities | Alternative Strategies | 2.70% | 1.21% | 3.91% | 16.55 |
| SWTZ | Switzer Dividend Growth Fund | Australia | Equities | Equity Australia Large Growth | 0.89% | 0.51% | 1.40% | 77.67 |
| HBRD | BetaShares Active Australian Hybrids Fund | Australia | Fixed Income & Cash | Bonds - Australia | 0.55% | n/a | 0.55% | 22.06 |
| Global | ||||||||
| DMKT | AMP Capital Dynamic Markets Fund | Global | Equities | Multisector Balanced | 0.50% | 0.60% | 1.10% | 25.53 |
| GROW | Schroder Real Return Fund | Global | Equities | Multisector Balanced | 0.90% | 0.43% | 1.33% | 45.25 |
| PIXX | Platinum International Fund | Global | Equities | Equity World Large Blend | 1.10% | n/a | 1.10% | 124.97 |
| MGE | Magellan Global Equities Fund | Global | Equities | Equity World Large Blend | 1.35% | 0.41% | 1.76% | 980.89 |
| MHG | Magellan Global Equities Fund Currency Hdg | Global | Equities | Equity World - Currency Hedged | 1.35% | 0.47% | 1.82% | 63.10 |
| MOGL | Montgomery Global Equities Fund | Global | Equities | Equity World Large Value | 1.89% | n/a | 1.89% | 62.58 |
| KII | K2 Global Equities Fund | Global | Equities | Alternative Strategies | 2.70% | 1.29% | 3.99% | 20.33 |
| GLIN | AMP Capital Global Infrastructur Securities Fund Unhdg | Global | Property & Infrastructure | Infrastructure - Global | 0.85% | 0.62% | 1.47% | 28.24 |
| RENT | AMP Capital Global Property Securities Fund Unhdg | Global | Property & Infrastructure | Equity Global Real Estate | 0.99% | 0.75% | 1.74% | 17.20 |
| MICH | Magellan Infrastructure Fund Ccy Hdg | Global | Property & Infrastructure | Infrastructure - Global | 1.05% | 0.40% | 1.45% | 145.28 |
Note: n/a indicates insufficient data due to recent listing.
Source: ASX and Morningstar
When identifying whether a fund is a suitable investment, some things to consider include:
- Cost: As seen in the above table, actively managed funds will generally charge higher fees than passive funds. This is the premium you pay for the managers skill in generating alpha.
- Performance: Elaborating on point 1, does the manager have a track record of consistent performance over longer time frames? Manager skill is worth paying for.
- Investment Objectives: Perhaps the most important consideration is understanding what you are investing in and how it fits as part of achieving your overall investment objective. It is not sensible to simply chase returns without regard to risk.
Given these funds are not intended to simply track their benchmark, we do not currently provide a star rating on them. The InvestSMART Star Rating is a measure designed to compare similar securities across a number of quantifiable metrics - size, costs, liquidity & tracking error. Throughout the analysis, this is denoted by 'Not Rated'.
Market Overview - FUM
The Australian ETF market exceeded expectations of $35bn in Funds under Management (FUM) by calendar year end.
While this has primarily been driven by inflows, strong performance across the traditional ‘risk’ asset classes, Commodities, Equities & Property have added to the FUM growth.
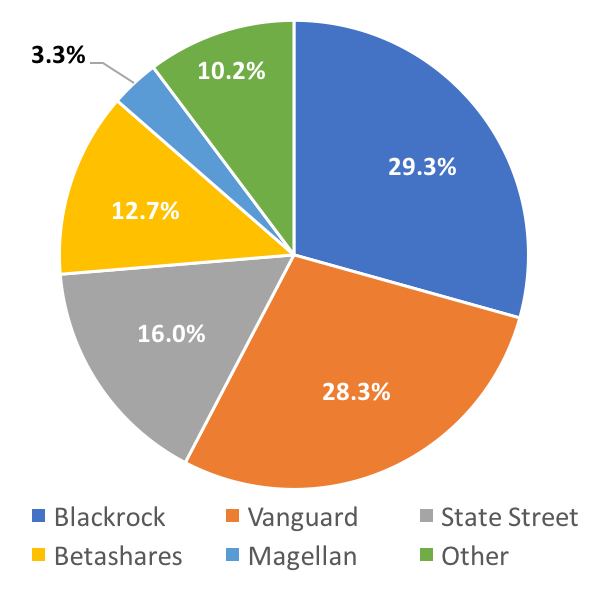
Figure 11: ETF Market breakdown by issuer
| Issuer | No. Funds (Sep) | No. Funds (Dec) | FUM $m (Sep) | FUM $m (Dec) | Market Share |
|---|---|---|---|---|---|
| Blackrock | 39 | 39 | 9,147.23 | 10,431.83 | 29.34% |
| Vanguard | 17 | 22 | 8,992.92 | 10,077.28 | 28.34% |
| State Street | 16 | 16 | 5,232.01 | 5,691.77 | 16.01% |
| Betashares | 40 | 42 | 4,227.48 | 4,527.69 | 12.73% |
| Magellan | 3 | 3 | 1,037.71 | 1,189.27 | 3.34% |
| VanEck | 10 | 10 | 706.56 | 969.78 | 2.73% |
| Russell | 6 | 6 | 621.96 | 647.82 | 1.82% |
| ETFS Securities | 15 | 15 | 768.75 | 889.28 | 2.50% |
| Market Vectors | 4 | 4 | 380.18 | 445.87 | 1.25% |
| UBS | 9 | 9 | 271.50 | 272.19 | 0.77% |
| Platinum | 2 | 2 | - | 194.76 | 0.55% |
| Switzer | 1 | 1 | 73.70 | 77.67 | 0.22% |
| Montgomery | 0 | 1 | - | 62.58 | 0.18% |
| Schroder | 1 | 1 | 41.90 | 45.25 | 0.13% |
| K2 Asset Management | 2 | 2 | 38.36 | 36.89 | 0.10% |
| 165 | 173 | 31,540.26 | 35,559.93 | 100.00% |
Source: ASX and Morningstar
New funds continue to be listed with 8 new securities across a range of categories coming online during the December quarter.
Figure 12: New ETF listings
| Security | Fund | Asset Class | Focus |
|---|---|---|---|
| VBND | Vanguard Global Aggregate Bd Hdg ETF | Fixed Income & Cash | Provide exposure to global income-generating securities. |
| HBRD | BetaShares Active Australian Hybrids Fund (managed fund) | Fixed Income & Cash | Provide exposure to an actively managed, diversified portfolio of hybrid securities. |
| VDCO | Vanguard Diversified Conservative ETF | Diversified | Diversified Fund of Funds. For investors with a low tolerance for risk. |
| VDBA | Vanguard Diversified Balanced ETF | Diversified | Diversified Funds of Funds. For investors seeking a balance between income and capital growth. |
| VDGR | Vanguard Diversified Growth ETF | Diversified | Diversified Funds of Funds. For investors seeking long-term capital growth. |
| VDHG | Vanguard Diversified High Growth ETF | Diversified | Diversified Fund of Funds. For investors with a high tolerance for risk who are seeking long-term capital growth. |
| FAIR | BetaShares Australian Sustnby Ldrs ETF | Equities | Ethical, sustainable focused Domestic Equity Fund. |
| MOGL | Montgomery Global Equities Fund (Managed Fund) | Equities | Value focused Global Equities Fund. |
Source: ASX and Morningstar
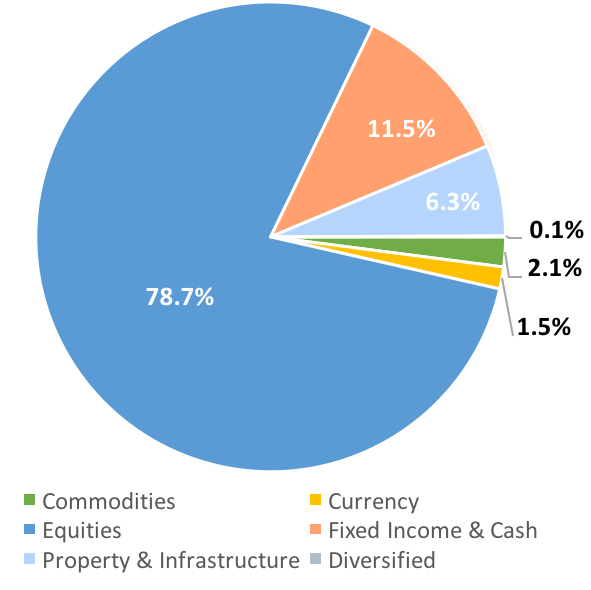
Figure 13: Australian ETF market breakdown
| Asset Class | Geography | Issuer |
|---|---|---|
| The largest asset class in terms of both product range as well as FUM is equities, representing over 75% of the market. | Geographically, the largest exposure for ETFs across the market is Australia, followed by those providing diversified global exposure. | With combined FUM over $30 billion, close to 90% of the Australian ETFs market is managed by five issuers, namely BlackRock, Vanguard, State Street, BetaShares and Magellan. |
 |
 |
 |
Source: ASX and Morningstar
Market Overview - Flows
Fund flow is an interesting metric when analysing the ETF market as it provides insight into ‘net demand’. Given the majority of ETFs are index tracking, that is they are designed to replicate the performance of a given market index or asset class, analysing flows gives an insight into trends in market sentiment toward a given thematic.
Overview
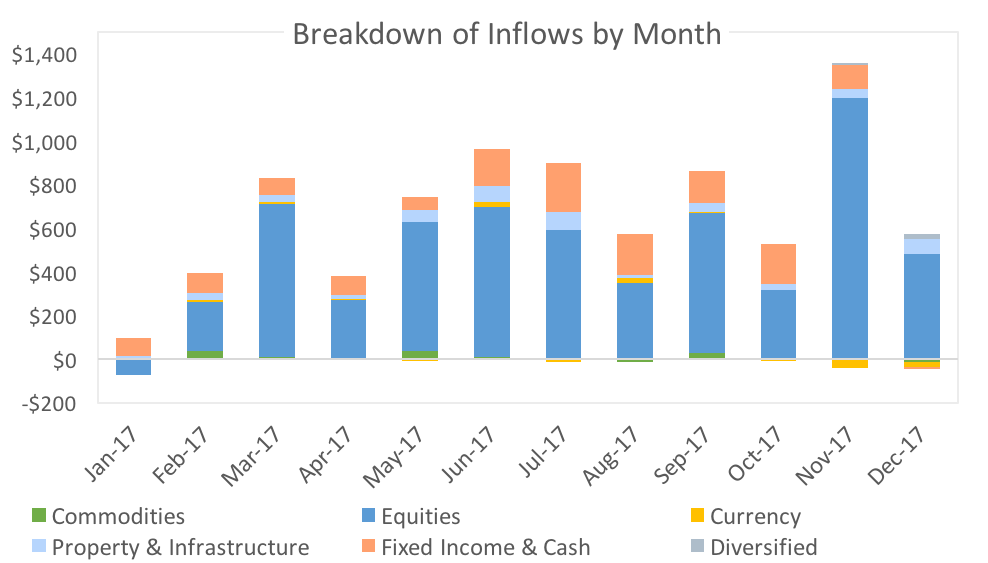
Figure 14: FUM Flows & Turnover
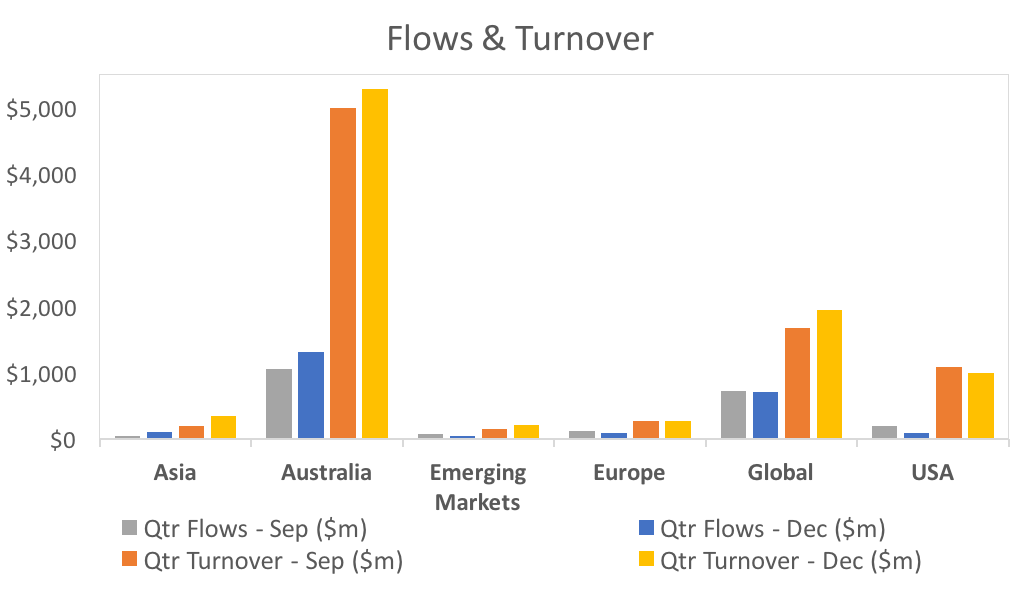
Source: ASX and Morningstar
Equities continue to see the majority of inflows, though the most notable change when compared to previous periods has been in the Fixed Income & Cash category. December was the first time this calendar year that there were net outflows in this category.
While ETFs designed to provide exposure to floating rate securities (FLOT, QPON & HBRD) saw net inflows, BetaShares Australia High Interest Cash ETF (AAA) saw net outflows of $75m during the month of December.
November saw exceptionally large equity market focused inflows with iShares Core S&P ASX 200 ETF (IOZ) making up over a third of this figure.
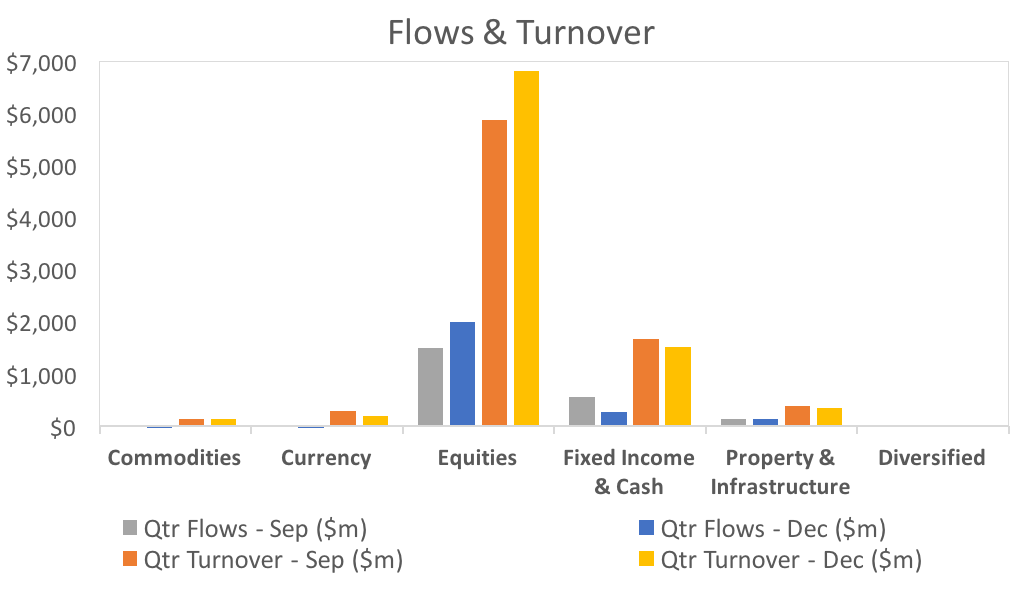
Figure 15: FUM Flows ($m) by Asset Class
Source: ASX and Morningstar
ETFs designed to provide broad based equity exposure saw the largest inflows for the quarter, while BetaShares Dividend Harvesting (HVST), US Dollar (USD) and British Pound (POU) ETFs saw the largest net outflows.
Figure 16: Largest Inflows (Qtr)
| ETF | Flows ($m) | Sub Category |
|---|---|---|
| [IOZ] iShares Core S&P/ASX 200 ETF | 510.71 | Equity Australia Large Blend |
| [VGS] Vanguard MSCI Index Intl ETF | 106.67 | Equity World Large Blend |
| [VHY] Vanguard Australian Shares High Yld ETF | 82.48 | Equity Australia Large Blend |
| [PIXX] Platinum International {Quoted Mngd Hdg} | 82.46 | Equity World Large Blend |
| [QPON] Betashares Aus Bank Sr Fitng Rt Bd ETF | 80.05 | Diversified Credit |
Source: ASX and Morningstar
Figure 17: Largest Outflows (Qtr)
| ETF | Qtr Flows ($m) | Sub Category |
|---|---|---|
| [HVST] BetaShares Australian Div Harvester (mgd) | -71.36 | Equity Australia Large Value |
| [USD] BetaShares US Dollar ETF | -33.87 | Miscellaneous |
| [POU] BetaShares British Pound ETF | -27.30 | Miscellaneous |
| [ETF] UBS IQ Morningstar Australia Quality ETF | -17.52 | Equity Australia Large Blend |
| [ITW] iShares MSCI Taiwan ETF | -16.59 | Equity World Other |
Source: ASX and Morningstar
Market Overview - Costs
There are two main components to the total cost of an ETF. The Management Expense Ratio (MER) and the difference between the Bid and the Offer (spread).
Generally speaking, simpler index tracking (passive) funds will have a lower MER than an Actively Managed Fund. This is primarily due to the difference in the objectives of the Fund Manager. While passive funds are designed to deliver returns in line with a benchmark, active funds are managed to outperform them and to do so consistently over long periods of time requires a greater level of oversight, experience and skill.
The spread is generally a function of the liquidity in the underlying securities and transactional costs to acquire them.
Overview
Figure 18: Cost Analysis
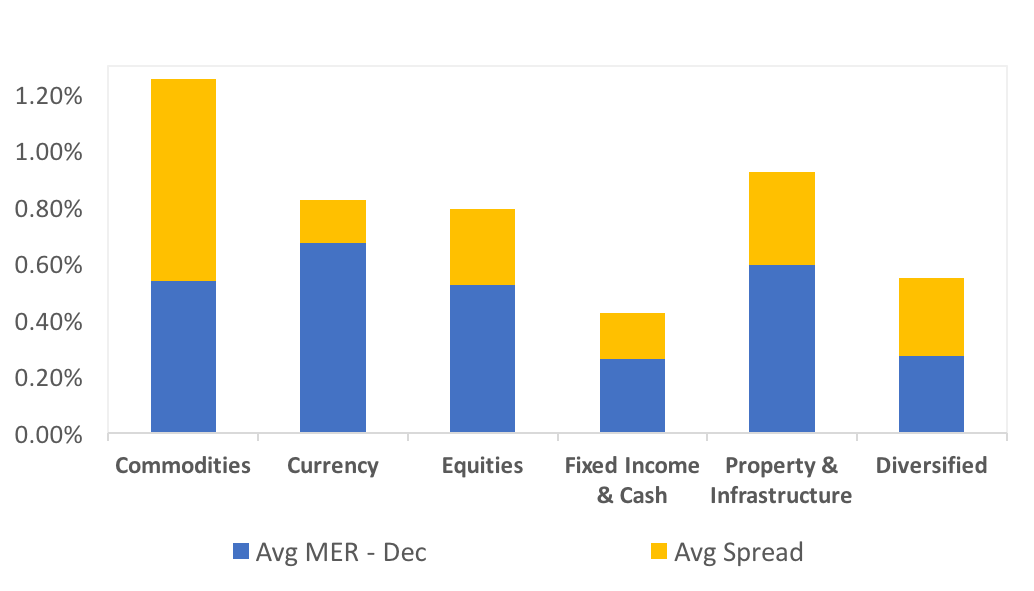
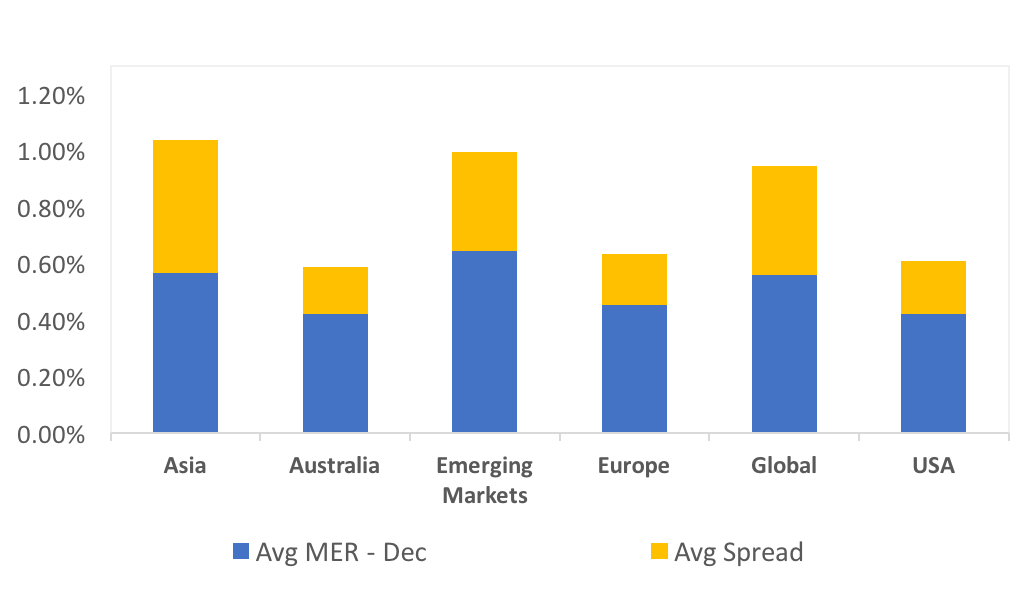
Source: ASX and Morningstar
Fixed income & cash remains the cheapest asset class, even after incorporating spreads.
At a security level, broad-based equity market and cash-focussed ETFs are the cheapest, which is reflective of underlying liquidity in these markets.
Geographically, ETFs focused on Australia and the US are, on average, the cheapest.
Per below, index tracking broad based equity and cash exposed ETFs are the cheapest with low MERs and tight spreads, whereas the active and more exotic strategies funds tend to be more expensive.
It should be emphasised though that high fees should not be cause for immediate dismissal when reviewing an ETF. If a particular security is suited to achieving your investment objective, or if in the case of an actively managed fund, long term performance warrants paying a higher fee, then they should be considered.
Figure 19: 5 cheapest ETFs
| ETF | MER | Qtr Avg Spread | Total Cost | Management Type |
|---|---|---|---|---|
| [BILL] iShares Core Cash ETF | 0.07% | 0.01% | 0.08% | Index Tracking |
| [IVV] iShares S&P 500 ETF | 0.04% | 0.05% | 0.09% | Index Tracking |
| [VTS] Vanguard US Total Market Shares ETF | 0.04% | 0.08% | 0.12% | Index Tracking |
| [ISEC] iShares Enhanced Cash ETF | 0.12% | 0.01% | 0.13% | Smart Beta |
| [VAS] Vanguard Australian Shares ETF | 0.14% | 0.04% | 0.18% | Index Tracking |
Source: ASX and Morningstar
Figure 20: 5 most expensive ETFs
| ETF | MER | Qtr Avg Spread | Total Cost | Management Type |
|---|---|---|---|---|
| [KII] K2 Global Equities Fund (Hedge Fund) | 2.70% | 1.37% | 4.07% | Actively Managed |
| [KSM] K2 Australian Small Cap Fund | 2.70% | 1.25% | 3.95% | Actively Managed |
| [QAG] BetaShares Agriculture ETF CcyHgd(Synth) | 0.69% | 1.61% | 2.30% | Index Tracking |
| [MOGL] Montgomery Global Equities Fund (Managed Fund) | 1.89% | 0.28% | 2.17% | Actively Managed |
| [QCB] BetaShares Com Basket ETF Ccy Hgd(Synth) | 0.69% | 1.43% | 2.12% | Index Tracking |
Source: ASX and Morningstar
Market Overview - Performance
A passively managed ETF should closely track its underlying index. Unlike active fund mandates, negative returns do not necessarily mean the fund manager is doing a bad job, but rather reflects the performance of the underlying securities the ETF has been designed to track.
When reviewing an actively managed fund though, cost vs long term performance is an important metric to consider.
Overview
Figure 21: 3, 6 & 12 month performance
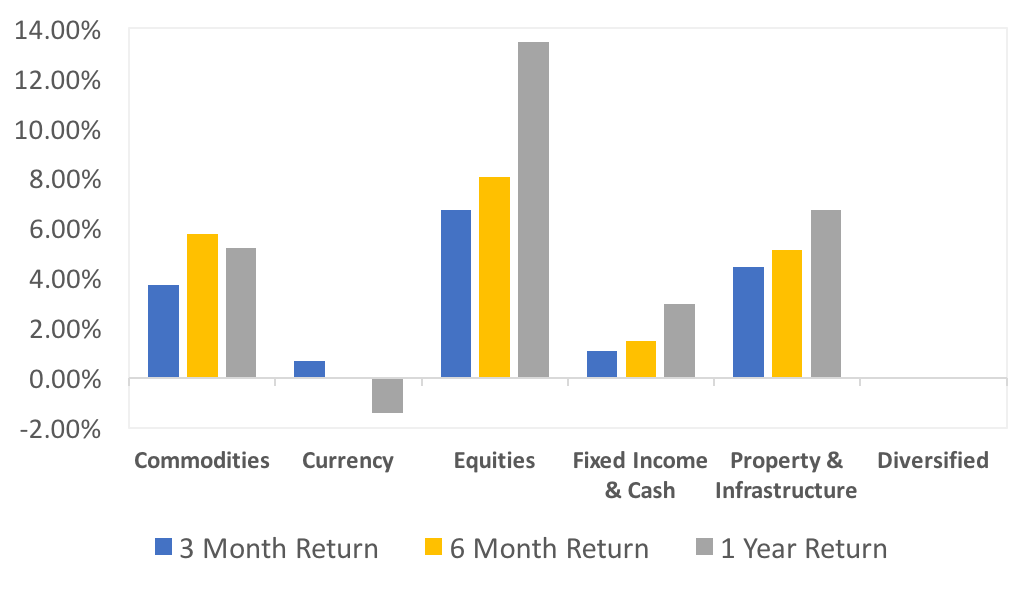
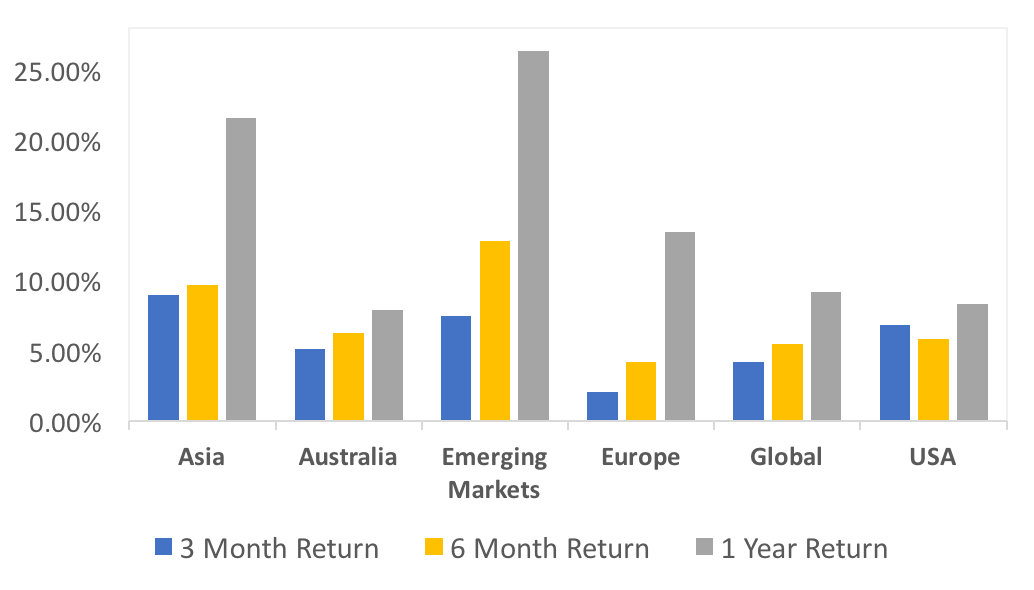
Source: ASX and Morningstar
Equities and resources were the standout performers during the period with many securities showing double digit returns for the quarter.
As a result and as would be expected, the ‘bear’ funds (BBOZ, BBUS & BEAR), that is those designed to deliver positive returns when equity markets fall, have performed poorly.
Geographically, ETFs exposed to Asia and emerging markets have delivered strong returns over the past year.Figure 22: Top 5 performing securities
| ETF | 3 Mnth Return | Sub Category |
|---|---|---|
| [IJR] iShares S&P Small-Cap ETF | 17.61% | Equity North America |
| [OOO] BetaShares Crude Oil ETF Ccy Hgd(Synth) | 15.69% | Commodities & Precious Metals |
| [GEAR] BetaShares Geared Australian Equity(Hdg) | 15.68% | Equity Australia Large Geared |
| [OZR] SPDR? S&P/ASX 200 Resources ETF | 15.48% | Equity Australia Other |
| [QRE] BetaShares S&P/ASX200 Res Sect ETF | 15.44% | Equity Australia Other |
Source: ASX and Morningstar
Figure 23: Worst 5 performing securities
| ETF | 3 Mnth Return | Sub Category |
|---|---|---|
| [BBOZ] BetaShares Australian Eqs Strong BearHdg | -15.51% | Alternative Strategies |
| [BBUS] BetaShares US Eqs Strong Bear H-Ccy Hdg | -14.16% | Alternative Strategies |
| [BEAR] BetaShares Aus Equities Bear Hedge | -6.74% | Alternative Strategies |
| [QAG] BetaShares Agriculture ETF CcyHgd(Synth) | -3.72% | Miscellaneous |
| [AUDS] BetaShares Strong Australian Dollar Hdg | -2.06% | Alternative Strategies |
Source: ASX and Morningstar
Market Overview - Yield
Yield is the income earned on an investment and is expressed as a percentage. Historically, Fixed income, Property & Infrastructure securities generate most of an investor’s return from distributions of income.
Equities are mixed given a company has the option to distribute profits or retain them to grow, while investments in Commodities and Currency return little to no returns from yield given they are non-income producing assets.
Figure 24: Average historic yield
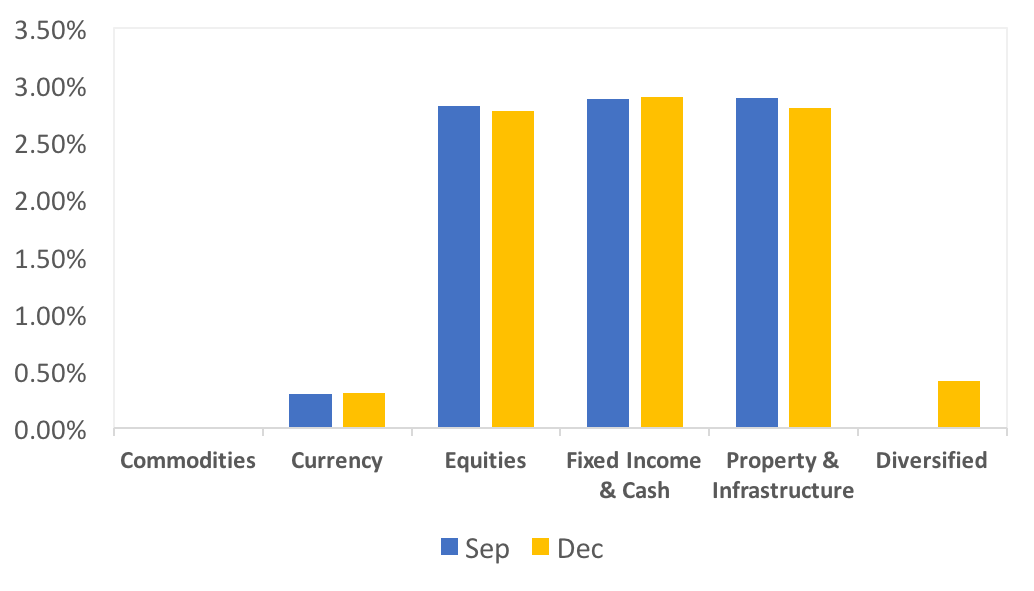
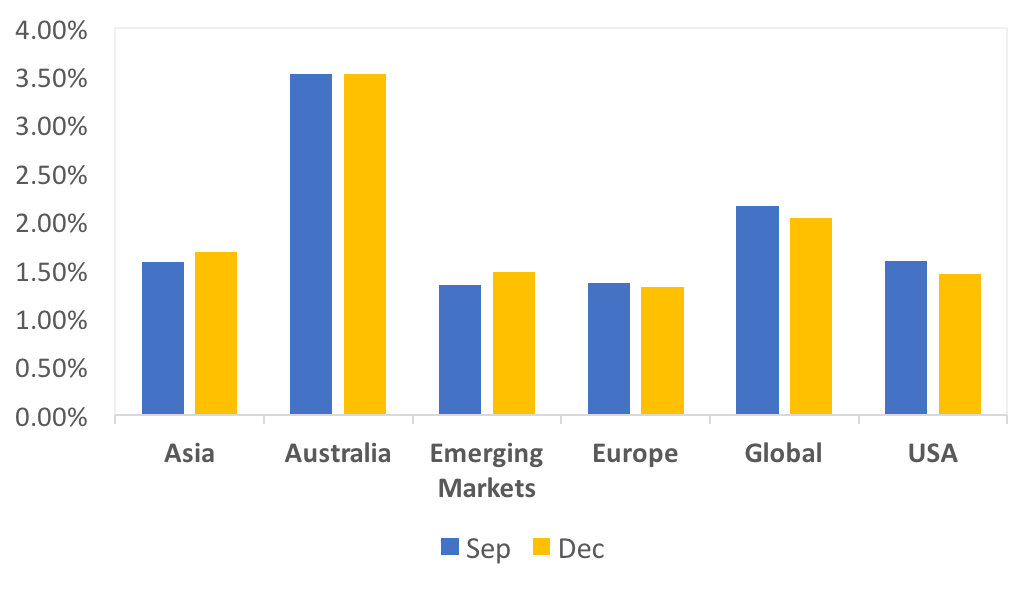
Source: Morningstar
Overview
As expected, Equities Fixed Income & Cash and Property & Infrastructure continue to provide the greatest income based returns on average.
Geographically, Australia sees the highest returns from income, reflective of our relatively high interest rates and equity pay-out ratios when compared to the rest of the world.
The highest yielding security for the year to December was BetaShares Australian Dividend Harvester (HVST). This fund is specifically aimed to generate regular franked dividend income by investing in large cap Australian shares.
Figure 25: Top 5 Yielding ETFs
| ETF | Historic Yield | Sub Category |
|---|---|---|
| [HVST] BetaShares Australian Div Harvester(mgd) | 11.23% | Equity Australia Large Value |
| [IHOO] iShares Global 100 AUD Hedged ETF | 11.15% | Equity World - Currency Hedged |
| [VCF] Vanguard Intl Credit Secs Idx (Hdg) ETF | 10.29% | Diversified Credit |
| [VIF] Vanguard Intl Fxd Intr Idx (Hdg) ETF | 10.17% | Bonds - Global |
| [ZYAU] ETFS S&P/ASX 300 High Yield Plus ETF | 9.95% | Equity Australia Large Blend |
Source: ASX and Morningstar
Securities Overview - Commodities
These securities are designed to provide exposure to the performance of various commodities and natural resources. The majority are physically backed, though there is a number of synthetic securities available.
We do not hold any Commodity focused ETFs in InvestSMART's Separately Managed Account (SMA) portfolio.
| Commodities | FUM ($m) | Qtr Flows | Avg Returns 3m | Avg Returns 12m |
|---|---|---|---|---|
| $ 729m | $ -20.8m | 3.70% | 5.20% |
| Avg Star Rating | Avg Yield | Avg MER | Qtr Avg Spread | No. Funds |
|---|---|---|---|---|
| 2.0 |
0.00% | 0.54% | 0.72% | 10 |
Source: ASX and Morningstar
Overview
While BetaShares Currency Hedged Gold Bullion ETF (QAU) saw net outflows for the quarter of $11.6m, ETF Securities Gold ETF (GOLD) saw $11m in net inflows. While it may be coincidental, it may also be reflective of a switch into the lower cost GOLD (0.40% MER) and of a view on the currency as GOLD is unhedged whereas QAU is hedged.
BetaShares Currency Hedged Agriculture ETF (QAG) was the only security of this category to deliver a negative return for the period, while rising oil prices saw BetaShares Oil ETF (OOO) deliver positive returns in excess of 15%.
Geographic Exposure
Figure 26: Commodity ETFs by Geography
Source: ETF Issuers^
^ETF Issuers indicates a combination of ETF providers as detailed in the Issuer column of Figure 11, as throughout the entire ETF report
Key Data: Commodity ETFs
Figure 27: Commodity ETFs
| Name | Code | FUM ($M) | Qtr Flows ($M) | MER | Qtr Avg Spread | 3MTH Return | 12MTH Return | Historical YLD | QTR AVG Liquidity | Sub Category | STAR Rating |
|---|---|---|---|---|---|---|---|---|---|---|---|
| GLOBAL | |||||||||||
| Agriculture | |||||||||||
| BetaShares Agriculture ETF CcyHgd(Synth) | QAG | 2.25 | -0.33 | 0.69% | 1.61% | -3.72% | -11.90% | 0.00% | 12.71% | Miscellaneous | 1 |
| Diversified Commodities | |||||||||||
| ETFS Physical PM Basket ETC | ETPMPM | 5.00 | 0.00 | 0.44% | 0.70% | 3.03% | 6.56% | 0.00% | 2.82% | Commodities & Precious Metals | 2 |
| BetaShares Com Basket ETF Ccy Hgd(Synth) | QCB | 8.12 | -1.77 | 0.69% | 1.43% | 5.51% | 4.15% | 0.00% | 17.67% | Commodities & Precious Metals | 1 |
| Gold. | |||||||||||
| ETFS Physical Gold ETC | GOLD | 559.99 | 11.03 | 0.40% | 0.14% | 0.84% | 2.70% | 0.00% | 4.42% | Commodities & Precious Metals | 4 |
| BetaShares Gold Bullion ETF Ccy Hedged | QAU | 49.21 | -11.68 | 0.59% | 0.28% | 0.40% | 10.67% | 0.00% | 19.39% | Commodities & Precious Metals | 2 |
| ETFS Physical Singapore Gold ETF | ZGOL | 13.26 | 0.00 | 0.40% | 0.24% | 0.96% | 3.14% | 0.00% | 4.12% | Commodities & Precious Metals | 2 |
| Oil | |||||||||||
| BetaShares Crude Oil ETF Ccy Hgd(Synth) | OOO | 32.36 | -15.26 | 0.69% | 0.25% | 15.69% | 3.00% | 0.00% | 17.36% | Commodities & Precious Metals | 2 |
| Palladium | |||||||||||
| ETFS Physical Palladium ETC | ETPMPD | 1.15 | -1.01 | 0.49% | 0.89% | 13.27% | 44.05% | 0.00% | 7.66% | Commodities & Precious Metals | 2 |
| Platinum | |||||||||||
| ETFS Physical Platinum ETC | ETPMPT | 1.16 | -1.80 | 0.49% | 0.83% | 0.74% | -6.05% | 0.00% | 6.35% | Commodities & Precious Metals | 2 |
| Silver | |||||||||||
| ETFS Physical Silver ETC | ETPMAG | 56.61 | 0.00 | 0.49% | 0.80% | 0.23% | -4.33% | 0.00% | 3.61% | Commodities & Precious Metals | 2 |
Source: ASX and Morningstar
Securities Overview - Currency
These securities are designed to track the performance of the Australian dollar relative to various currencies.
We do not hold any Currency focussed ETFs in InvestSMART'S Separately Managed Account (SMA) portfolios.
| Currency | FUM ($m) | Qtr Flows | Avg Returns 3m | Avg Returns 12m |
|---|---|---|---|---|
| $ 536m | $ -59.2m | 0.66% | -1.42% |
| Avg Star Rating | Avg Yield | Avg MER | Qtr Avg Spread | No. Funds |
|---|---|---|---|---|
| 2.9 |
0.30% | 0.67% | 0.15% | 7 |
Source: ASX and Morningstar
Overview
USD and POU provide investors with a way to gain exposure to a falling Australian dollar relative to the US Dollar and British Pound respectively and the December quarter saw large outflows in each of these funds. The consensus view is that the AUD will be lower by year end with low expectations of a rate rise in 2018 compared to more hawkish foreign central banks.
Geographic Exposure
Figure 28: Currency ETFs by Geography
Source: ETF Issuers
Key Data: Currency ETFs
Figure 29: Currency ETFs
| Name | Code | FUM ($M) | Qtr Flows ($M) | MER | Qtr Avg Spread | 3MTH Return | 12MTH Return | Historical YLD | QTR AVG Liquidity | Sub Category | STAR Rating |
|---|---|---|---|---|---|---|---|---|---|---|---|
| ASIA | |||||||||||
| ETFS Physical Renminbi ETF | ZCNH | 0.46 | 0.00 | 0.30% | 0.24% | 2.41% | -1.17% | 0.00% | 1.28% | Miscellaneous | 2 |
| EUROPE | |||||||||||
| BetaShares Euro ETF | EEU | 6.92 | 1.14 | 0.45% | 0.12% | 1.79% | 4.90% | 0.00% | 15.51% | Miscellaneous | 3 |
| BetaShares British Pound ETF | POU | 28.95 | -27.30 | 0.45% | 0.09% | 1.10% | 1.03% | 0.00% | 32.28% | Miscellaneous | 3 |
| AUSTRALIA | |||||||||||
| BetaShares Strong Australian Dollar Hdg | AUDS | 1.61 | 0.00 | 1.38% | 0.19% | -2.06% | 19.26% | 1.95% | 79.49% | Alternative Strategies | 2 |
| USA | |||||||||||
| BetaShares US Dollar ETF | USD | 472.87 | -33.87 | 0.45% | 0.10% | 0.36% | -7.41% | 0.17% | 9.93% | Miscellaneous | 5 |
| BetaShares Strong US Dollar Hedge | YANK | 11.82 | -1.35 | 1.38% | 0.15% | 0.56% | -19.46% | 0.00% | 17.89% | Alternative Strategies | 2 |
| ETFS Physical US Dollar ETF | ZUSD | 14.22 | 2.16 | 0.30% | 0.15% | 0.46% | -7.11% | 0.00% | 14.51% | Miscellaneous | 3 |
Source: ASX and Morningstar
Securities Overview - Property & Infrastructure
These securities are designed to track various Domestic and Global Property & Infrastructure indexes.
We hold positions in VAP, IFRA & DJRE in InvestSMART's Separately Managed Account (SMA) portfolios.
| Property & Infrastructure | FUM ($m) | Qtr Flows | Avg Returns 3m | Avg Returns 12m |
|---|---|---|---|---|
| $ 2226m | $ 140.7m | 4.42% | 6.69% |
| Avg Star Rating | Avg Yield | Avg MER | Qtr Avg Spread | No. Funds |
|---|---|---|---|---|
| 2.9 |
2.80% | 0.59% | 0.33% | 9 |
Source: ASX and Morningstar
Overview
Domestic focused REITs were the best performing category this quarter with MVA, SLF & VAP all delivering returns in excess of 7% for the 3 months to December. Below we list these three securities head to head. It is interesting to note that despite a relatively small pool of potential securities to invest in, there are three ETFs designed to track Domestic REITs. Per below, you can see that each is constructed slightly differently and this will result is slightly different outcomes. It is important to dive deeper into an ETFs construction when selecting one that is right for you.
Geographic Exposure
Figure 30: Property & Infrastructure ETFs by Geography
Source: ETF Issuers
Figure 31: Comparison of Australian REIT ETFs
| VanEck Vectors Australian Property ETF | SPDR S&P/ASX 200 Listed Property ETF | Vanguard Australian Property Securities ETF | |
|---|---|---|---|
| Code | MVA | SLF | VAP |
| Manager | VanEck | State Street | Vanguard |
| Benchmark | MVIS Australian A-REIT Index | S&P/ASX 200 A-REITs | S&P/ASX 300 A-REITs |
| Benchmark Methodology | Market Capitalisation | Market Capitalisation | Market Capitalisation |
| Benchmark Constituents | 11 | 20 | 31 |
| Star Rating | 3 Stars | 4 Stars | 4 Stars |
| MER | 0.35% | 0.40% | 0.23% |
| Avg Spread | 0.15% | 0.18% | 0.09% |
| 12 Month Return | 7.27% | 5.56% | 6.61% |
| Tracking Error | 0.15% | 0.09% | 0.09% |
| Distribution Frequency | Semi-Annual | Quarterly | Quarterly |
Source: ASX and Morningstar
VAP is our preferred security in this space given greater diversification with 31 underlying securities, low tracking error, MER and spread.
Invest in the InvestSMART Property and Infrastructure Portfolio
Key Data: Property & Infrastructure ETFs
Figure 32: Property & Infrastructure ETFs
| Name | Code | FUM ($M) | Qtr Flows ($M) | MER | Qtr Avg Spread | 3MTH Return | 12MTH Return | Historical YLD | QTR AVG Liquidity | Sub Category | STAR Rating |
|---|---|---|---|---|---|---|---|---|---|---|---|
| AUSTRALIA | |||||||||||
| Property | |||||||||||
| VanEck Vectors Australian Property ETF | MVA | 77.92 | 2.90 | 0.35% | 0.16% | 7.07% | 7.27% | 5.47% | 5.31% | Equity Australia Real Estate | 3 |
| SPDR? S&P/ASX 200 Listed Property ETF | SLF | 598.21 | -3.91 | 0.40% | 0.18% | 7.77% | 5.56% | 4.09% | 3.60% | Equity Australia Real Estate | 4 |
| Vanguard Australian Property Secs ETF | VAP | 1,098.93 | 66.54 | 0.23% | 0.08% | 7.72% | 6.61% | 2.58% | 5.15% | Equity Australia Real Estate | 4 |
| GLOBAL | |||||||||||
| Infrastructure | |||||||||||
| AMP Capital Global Infras Secs Unhdg | GLIN | 28.24 | 3.55 | 0.85% | 0.70% | 0.81% | 8.22% | 2.07% | 5.36% | Infrastructure - Global | Not Rated |
| VanEck Vectors FTSE Glbl Infras(Hdg)ETF | IFRA | 64.06 | 14.32 | 0.52% | 0.20% | 2.09% | 14.61% | 3.17% | 13.63% | Infrastructure - Global | 3 |
| Magellan Infrastructure Ccy Hdg ETF | MICH | 145.28 | 30.66 | 1.05% | 0.44% | 3.02% | 16.35% | 2.69% | 8.03% | Infrastructure - Global | Not Rated |
| ETFS Global Core Infrastructure ETF | CORE | 2.34 | 1.60 | 0.45% | N/A | 2.28% | 0.00% | 0.22% | 41.39% | Equity World Other | 2 |
| Property | |||||||||||
| SPDR? Dow Jones Global Real Estate ETF | DJRE | 194.06 | 25.84 | 0.50% | 0.13% | 3.81% | -0.77% | 3.45% | 10.58% | Equity Global Real Estate | 3 |
| AMP Capital Global Property Secs Unhdg | RENT | 17.20 | -0.75 | 0.99% | 0.82% | 5.19% | 2.40% | 1.46% | 5.18% | Equity Global Real Estate | Not Rated |
Source: ASX and Morningstar
Securities Overview - Fixed Income & Cash
These securities are designed to provide investors access to domestic and global Fixed Income & Cash securities.
We hold positions in AAA, FLOT & IAF in InvestSMART's Separately Managed Account (SMA) portfolios.
| Fixed Income & Cash | FUM ($m) | Qtr Flows | Avg Returns 3m | Avg Returns 12m |
|---|---|---|---|---|
| $ 4089m | $ 278.4m | 1.07% | 2.94% |
| Avg Star Rating | Avg Yield | Avg MER | Qtr Avg Spread | No. Funds |
|---|---|---|---|---|
| 3.3 |
2.9% | 0.26% | 0.16% | 25 |
Source: ASX and Morningstar
Overview
Domestic Government Bonds were the best performing of the fixed interest securities over both the quarter and the last 12 months. The majority of inflows were directed to funds exposed to floating rate securities (HBRD, QPON, FLOT) and domestic corporate fixed rate securities (PLUS & VACF).
Vanguard listed a new Hedged Global Bond Fund (VBND) in October which seeks to provide exposure to high-quality, income-generating securities issued by governments, government-owned entities, government-guaranteed entities, investment-grade corporate issues and securitised assets from around the world.
with the InvestSMART Hybrid Income Portfolio
Geographic Exposure
Figure 33: Fixed Income & Cash ETFs by Geography
Source: ETF Issuers
Key Data: Fixed Income & Cash ETFs
Figure 34: Fixed Income & Cash ETFs
| Name | Code | FUM ($M) | Qtr Flows ($M) | MER | Qtr Avg Spread | 3MTH Return | 12MTH Return | Historical YLD | QTR AVG Liquidity | Sub Category | STAR Rating |
|---|---|---|---|---|---|---|---|---|---|---|---|
| GLOBAL | |||||||||||
| Corporate | |||||||||||
| iShares Core Global Corp Bd AUDH ETF | IHCB | 85.57 | 6.40 | 0.26% | 0.20% | 1.28% | 5.68% | 2.91% | 14.23% | Bonds - Global | 3 |
| iShares Global High Yield Bond AUDH ETF | IHHY | 23.62 | -2.13 | 0.56% | 0.25% | 0.27% | 6.78% | 6.46% | 33.02% | High Yield Credit | 2 |
| Diversified | |||||||||||
| iShares JP Morgan USD EmMkts Bd AUDH ETF | IHEB | 12.04 | 1.07 | 0.51% | 0.19% | 1.14% | 10.16% | 3.29% | 51.82% | Bonds-Emerging Market Debt | 2 |
| Vanguard Intl Credit Secs Idx (Hdg) ETF | VCF | 112.68 | -10.81 | 0.30% | 0.22% | 1.13% | 5.23% | 10.29% | 16.83% | Diversified Credit | 3 |
| Vanguard Global Aggregate Bd Hdg ETF | VBND | 4.55 | 4.53 | 0.20% | N/A | 0.00% | 0.00% | 0.37% | 47.16% | Bonds - Global | 2 |
| Government | |||||||||||
| Vanguard Intl Fxd Intr Idx (Hdg) ETF | VIF | 159.90 | 10.03 | 0.20% | 0.19% | 0.83% | 2.57% | 10.17% | 10.66% | Bonds - Global | 3 |
| AUSTRALIA | |||||||||||
| Cash | |||||||||||
| BetaShares Aus High Interest Cash ETF | AAA | 1,257.38 | -6.16 | 0.18% | 0.02% | 0.50% | 2.03% | 2.01% | 17.51% | Australian Cash | 5 |
| iShares Core Cash ETF | BILL | 163.85 | 8.02 | 0.07% | 0.01% | 0.42% | 0.00% | 0.89% | 5.56% | Australian Cash | 5 |
| iShares Enhanced Cash ETF | ISEC | 16.06 | 1.00 | 0.12% | 0.01% | 0.51% | 0.00% | 1.06% | 8.29% | Australian Short Term Fixed Interest | 4 |
| UBS IQ Cash ETF | MONY | 1.00 | 0.00 | 0.18% | 0.06% | 0.26% | 0.00% | 0.97% | 2.83% | Australian Cash | 4 |
| Corporate | |||||||||||
| VanEck Vectors Australian Corp Bd ETF | PLUS | 151.04 | 70.60 | 0.32% | 0.23% | 1.64% | 0.00% | 1.85% | 18.99% | Diversified Credit | 4 |
| Russell Inv Australian Select CorpBd ETF | RCB | 154.08 | 6.09 | 0.28% | 0.23% | 1.04% | 4.98% | 4.22% | 6.11% | Bonds - Australia | 3 |
| Vanguard Australian Corp Fxd Intr ETF | VACF | 84.07 | 21.20 | 0.26% | 0.18% | 1.43% | 5.03% | 2.94% | 12.09% | Bonds - Australia | 3 |
| VanEck Vectors Australian Fltng Rt ETF | FLOT | 52.15 | 31.13 | 0.22% | 0.06% | 0.66% | 0.00% | 1.44% | 28.31% | Diversified Credit | 4 |
| Betashares Aus Bank Sr Fltng Rt Bd ETF | QPON | 190.85 | 80.05 | 0.22% | 0.04% | 0.82% | 0.00% | 1.34% | 24.52% | Diversified Credit | 4 |
| Diversified | |||||||||||
| iShares Core Composite Bond ETF | IAF | 494.27 | 38.52 | 0.20% | 0.12% | 1.39% | 3.47% | 2.29% | 5.83% | Bonds - Australia | 4 |
| Vanguard Australian Fixed Interest ETF | VAF | 679.81 | 0.23 | 0.20% | 0.07% | 1.39% | 3.50% | 2.88% | 6.25% | Bonds - Australia | 4 |
| Government | |||||||||||
| SPDR? S&P/ASX Australian Bond ETF | BOND | 28.59 | 0.02 | 0.24% | 0.15% | 1.99% | 4.05% | 2.67% | 5.64% | Bonds - Australia | 3 |
| SPDR? S&P/ASX Australian Govt Bd ETF | GOVT | 12.87 | -2.55 | 0.22% | 0.12% | 1.90% | 3.68% | 2.35% | 11.32% | Bonds - Australia | 3 |
| iShares Treasury ETF | IGB | 21.32 | -8.21 | 0.26% | 0.19% | 1.52% | 3.21% | 2.65% | 11.02% | Bonds - Australia | 3 |
| iShares Government Inflation ETF | ILB | 99.24 | 2.34 | 0.26% | 0.35% | 2.54% | 3.47% | 0.94% | 5.09% | Bonds - Inflation - Linked | 3 |
| Russell Inv Australian Government Bd ETF | RGB | 59.88 | 0.01 | 0.24% | 0.29% | 1.74% | 3.65% | 3.14% | 2.09% | Bonds - Australia | 3 |
| Russell Inv Australian Semi-Govt Bd ETF | RSM | 60.88 | 0.03 | 0.26% | 0.27% | 0.95% | 2.85% | 2.36% | 2.09% | Bonds - Australia | 3 |
| Vanguard Australian Government Bond ETF | VGB | 141.88 | 4.99 | 0.20% | 0.11% | 1.45% | 3.20% | 2.56% | 9.91% | Bonds - Australia | 4 |
| Hybrids | |||||||||||
| BetaShares Active Australian Hybrids Fund (managed fund) | HBRD | 22.06 | 22.04 | N/A | 0.28% | 0.00% | 0.00% | 0.47% | 183.56% | Bonds - Australia | Not Rated |
Source: ASX and Morningstar
Securities Overview - Diversified
These securities are designed to provide investors with diversified multi sector asset allocation.
We do not hold any Diversified ETFs InvestSMART's Separately Managed Account (SMA) portfolios.
| Diversified | FUM ($m) | Qtr Flows | Avg Returns 3m | Avg Returns 12m |
|---|---|---|---|---|
| $ 23m | $ 30.9m | 0.00% | 0.00% |
| Avg Star Rating | Avg Yield | Avg MER | Qtr Avg Spread | No. Funds |
|---|---|---|---|---|
| 2.0 |
0.42% | 0.27% | 0.28% | 4 |
Source: ASX and Morningstar
Overview
Vanguard listed the Australia markets' first multisector or 'diversified' ETFs in November. These listed fund of funds follow the same principles that our diversified Separately Managed Account (SMA) portfolio does. Given they have only just listed, we will look to review them in greater detail next quarter as data is limited at the time of writing.
Geographic Exposure
Figure 35: Diversified ETFs by Geography
Source: ETF Issuers
Key Data: Diversified ETFs
Figure 36: Diversified ETFs
| Name | Code | FUM ($M) | Qtr Flows ($M) | MER | Qtr Avg Spread | 3MTH Return | 12MTH Return | Historical YLD | QTR AVG Liquidity | Sub Category | STAR Rating |
|---|---|---|---|---|---|---|---|---|---|---|---|
| GLOBAL | |||||||||||
| Balanced | |||||||||||
| Vanguard Diversified Balanced ETF | VDBA | 3.53 | 4.03 | 0.27% | N/A | 0.00% | 0.00% | 0.25% | 60.89% | Multisector Balanced | 2 |
| Conservative | |||||||||||
| Vanguard Diversified Conservative ETF | VDCO | 1.00 | 1.00 | 0.27% | N/A | 0.00% | 0.00% | 0.37% | 54.87% | Multisector Moderate | 2 |
| High Growth | |||||||||||
| Vanguard Diversified High Growth ETF | VDHG | 14.20 | 19.25 | 0.27% | N/A | 0.00% | 0.00% | 0.57% | 75.54% | Multisector Aggressive | 2 |
| Growth | |||||||||||
| Vanguard Diversified Growth ETF | VDGR | 4.55 | 6.57 | 0.27% | N/A | 0.00% | 0.00% | 0.48% | 77.15% | Multisector Growth | 2 |
Source: ASX and Morningstar
Securities Overview - Equities
This group of securities provides the investor with broad-based as well as specific sector exposure across domestic and international equity markets. There are an increasing number of ETFs designed to achieve specific rules-based objectives, for example High Yield, Ethical, Value, Momentum.
We hold positions in IAA, IVV, VEQ, VEU, UMAX & IOZ in InvestSMART's Separately Managed Account (SMA) portfolios.
| Equities | FUM ($m) | Qtr Flows | Avg Returns 3m | Avg Returns 12m |
|---|---|---|---|---|
| $ 27954m | $ 1998.8m | 6.71% | 13.43% |
| Avg Star Rating | Avg Yield | Avg MER | Qtr Avg Spread | No. Funds |
|---|---|---|---|---|
| 2.9 |
2.78% | 0.52% | 0.27% | 118 |
Source: ASX and Morningstar
Overview
Equity focused ETFs saw close to $2bn in net inflows in Dec Qtr on the back of strong equity market performance globally. These sentiments were shared in the domestic market with the iShares Core S&P ASX 200 ETF (IOZ) seeing huge inflows of over $500m.
In terms of performance, on a Geographic basis ETFs exposed to US and Asian markets saw the best returns for the quarter.
Invest in the InvestSMART International Equities Portfolio
Geographic Exposure
Figure 37: Equity ETFs by Geography
Source: ETF Issuers
Key Data: Equity ETFs
Figure 38: Equity ETFs Europe
| Name | Code | FUM ($M) | Qtr Flows ($M) | MER | Qtr Avg Spread | 3MTH Return | 12MTH Return | Historical YLD | QTR AVG Liquidity | Sub Category | STAR Rating |
|---|---|---|---|---|---|---|---|---|---|---|---|
| EUROPE | |||||||||||
| Equities - Broad | |||||||||||
| ETFS EURO STOXX 50? ETF | ESTX | 51.09 | 26.55 | 0.35% | 0.19% | -0.46% | 15.13% | 1.15% | 27.89% | Equity Europe | 3 |
| BetaShares WisdomTree Europe ETF-Ccy Hdg | HEUR | 53.62 | 5.15 | 0.58% | 0.18% | -1.15% | 14.10% | 1.44% | 15.01% | Equity Europe | 3 |
| iShares Europe ETF (AU) | IEU | 775.57 | 61.07 | 0.60% | 0.13% | 8.58% | 26.20% | 2.07% | 5.98% | Equity Europe | 3 |
| Vanguard FTSE Europe Shares ETF | VEQ | 141.52 | 22.80 | 0.35% | 0.19% | 2.17% | 16.94% | 2.22% | 9.03% | Equity Europe | 3 |
| Equities - Strategy | |||||||||||
| UBS IQ MSCI Europe Ethical ETF | UBE | 10.23 | 1.10 | 0.40% | 0.34% | 2.35% | 16.18% | 2.41% | 5.75% | Equity Europe | 2 |
Source: ASX and Morningstar
Figure 39: Breakdown - Equity ETFs Emerging Markets
| Name | Code | FUM ($M) | Qtr Flows ($M) | MER | Qtr Avg Spread | 3MTH Return | 12MTH Return | Historical YLD | QTR AVG Liquidity | Sub Category | STAR Rating |
|---|---|---|---|---|---|---|---|---|---|---|---|
| EMERGING MARKETS | |||||||||||
| Equities - Broad | |||||||||||
| iShares MSCI BRIC ETF (AU) | IBK | 35.46 | 1.01 | 0.72% | 0.70% | 8.98% | 31.61% | 1.31% | 7.34% | Equity Emerging Markets | 2 |
| iShares MSCI Emerging Markets ETF (AU) | IEM | 610.00 | 19.69 | 0.72% | 0.16% | 7.68% | 28.37% | 1.63% | 7.48% | Equity Emerging Markets | 3 |
| Vanguard FTSE Emerging Markets Shrs ETF | VGE | 180.06 | 30.38 | 0.48% | 0.28% | 6.05% | 20.88% | 1.67% | 11.77% | Equity Emerging Markets | 3 |
| SPDR? S&P Emerging Markets ETF | WEMG | 17.21 | -4.14 | 0.65% | 0.27% | 7.27% | 24.59% | 1.29% | 20.95% | Equity Emerging Markets | 2 |
Source: ASX and Morningstar
Figure 40: Equity ETFs USA
| Name | Code | FUM ($M) | Qtr Flows ($M) | MER | Qtr Avg Spread | 3MTH Return | 12MTH Return | Historical YLD | QTR AVG Liquidity | Sub Category | STAR Rating |
|---|---|---|---|---|---|---|---|---|---|---|---|
| USA | |||||||||||
| Equities - Broad | |||||||||||
| iShares S&P Mid-Cap ETF | IJH | 124.84 | -2.81 | 0.07% | 0.30% | 15.10% | 15.24% | 1.01% | 9.26% | Equity North America | 4 |
| iShares S&P Small-Cap ETF | IJR | 108.52 | 10.34 | 0.07% | 0.51% | 17.61% | 14.39% | 1.02% | 6.02% | Equity North America | 4 |
| iShares Russell 2000 ETF (AU) | IRU | 76.59 | 7.63 | 0.20% | 0.50% | 15.14% | 15.09% | 1.06% | 5.74% | Equity North America | 2 |
| iShares S&P 500 ETF | IVV | 2,504.48 | 16.30 | 0.04% | 0.05% | 12.45% | 19.48% | 1.49% | 5.25% | Equity North America | 5 |
| BetaShares NASDAQ 100 ETF | NDQ | 247.80 | 42.86 | 0.48% | 0.11% | 7.43% | 22.28% | 0.41% | 11.33% | Equity North America | 4 |
| BetaShares FTSE RAFI US 1000 ETF | QUS | 39.62 | 6.34 | 0.40% | 0.14% | 6.73% | 6.97% | 2.13% | 11.89% | Equity North America | 3 |
| SPDR? S&P 500 ETF | SPY | 19.58 | -2.15 | 0.09% | 0.14% | 12.45% | 19.37% | 1.59% | 20.38% | Equity North America | 4 |
| Vanguard US Total Market Shares ETF | VTS | 1,179.95 | 38.10 | 0.04% | 0.08% | 6.15% | 11.62% | 1.46% | 4.46% | Equity North America | 5 |
| Equities - Strategy | |||||||||||
| BetaShares Geared US Eq- Ccy Hdg | GGUS | 14.38 | 3.12 | 0.80% | 0.11% | 14.07% | 45.14% | 0.62% | 47.54% | Equity World - Currency Hedged | 2 |
| iShares S&P 500 AUD Hedged ETF | IHVV | 103.01 | 9.14 | 0.10% | 0.10% | 6.86% | 21.94% | 1.74% | 12.02% | Equity North America | 4 |
| UBS IQ MSCI USA Ethical ETF | UBU | 6.37 | 0.00 | 0.20% | 0.21% | 6.77% | 12.03% | 1.88% | 5.12% | Equity North America | 2 |
| BetaShares S&P 500 Yield Maximiser | UMAX | 92.98 | -1.76 | 0.79% | 0.16% | 3.98% | 6.93% | 4.08% | 4.68% | Equity World Other | 3 |
| ETFS S&P 500 High Yield Low Volatil ETF | ZYUS | 57.56 | 3.16 | 0.35% | 0.18% | 4.43% | 2.25% | 6.04% | 8.19% | Equity North America | 3 |
| BetaShares US Eqs Strong Bear H-Ccy Hdg | BBUS | 56.10 | -4.88 | 1.38% | 0.20% | -14.16% | -36.75% | 0.00% | 19.04% | Alternative Strategies | 2 |
Source: ASX and Morningstar
Figure 41: Equity ETFs, Asia
| Name | Code | FUM ($M) | Qtr Flows ($M) | MER | Qtr Avg Spread | 3MTH Return | 12MTH Return | Historical YLD | QTR AVG Liquidity | Sub Category | STAR Rating |
|---|---|---|---|---|---|---|---|---|---|---|---|
| ASIA | |||||||||||
| Equities - Broad | |||||||||||
| Market Vectors ChinaAMC A-Share ETF(Syn) | CETF | 9.43 | 4.08 | 0.72% | 0.43% | 5.92% | 20.76% | 0.92% | 40.99% | Equity Greater China | 2 |
| BetaShares WisdomTree Japan ETF-Ccy Hdg | HJPN | 78.12 | 25.50 | 0.58% | 0.18% | 9.32% | 22.81% | 2.15% | 26.34% | Equity Japan | 3 |
| iShares Asia 50 ETF (AU) | IAA | 386.29 | 31.16 | 0.50% | 0.45% | 12.02% | 33.60% | 1.25% | 5.88% | Equity Asia Pacific w/o Japan | 3 |
| iShares MSCI Hong Kong ETF (AU) | IHK | 16.95 | 4.63 | 0.48% | 0.98% | 7.91% | 20.13% | 3.78% | 17.99% | Equity World Other | 2 |
| iShares MSCI Japan ETF (AU) | IJP | 206.00 | 10.52 | 0.48% | 0.24% | 14.68% | 20.51% | 1.08% | 10.98% | Equity Japan | 3 |
| iShares MSCI South Korea ETF (AU) | IKO | 40.59 | -8.30 | 0.64% | 0.68% | 14.76% | 37.11% | 2.51% | 8.33% | Equity World Other | 2 |
| iShares MSCI Singapore ETF | ISG | 6.42 | -2.51 | 0.48% | 0.71% | 11.63% | 26.79% | 2.99% | 7.41% | Equity World Other | 2 |
| iShares MSCI Taiwan ETF | ITW | 45.24 | -16.59 | 0.64% | 1.05% | 3.16% | 19.26% | 2.43% | 10.61% | Equity World Other | 2 |
| iShares China Large-Cap ETF (AU) | IZZ | 92.54 | 7.88 | 0.74% | 0.51% | 9.17% | 22.86% | 1.99% | 13.71% | Equity Greater China | 2 |
| Vanguard FTSE Asia ex Japan Shrs Idx ETF | VAE | 52.89 | 14.52 | 0.40% | 0.26% | 8.90% | 28.15% | 2.80% | 22.03% | Equity Asia Pacific w/o Japan | 3 |
| Platinum Asia (Quoted Managed Hdg) | PAXX | 69.79 | 36.65 | 1.10% | N/A | 9.09% | 0.00% | 0.00% | 22.27% | Equity Asia Pacific w/o Japan | Not rated |
| Equities - Strategy | |||||||||||
| UBS IQ MSCI Japan Ethical ETF | UBJ | 4.47 | 0.96 | 0.40% | 0.23% | 8.77% | 14.43% | 1.38% | 5.12% | Equity Japan | 2 |
| UBS IQ MSCI Asia APEX 50 Ethical ETF | UBP | 8.91 | 4.64 | 0.45% | 0.37% | 8.10% | 37.15% | 0.32% | 47.55% | Equity Asia Pacific w/o Japan | 2 |
Source: ASX and Morningstar
Figure 42: Equity ETFs Australia
| Name | Code | FUM ($M) | Qtr Flows ($M) | MER | Qtr Avg Spread | 3MTH Return | 12MTH Return | Historical YLD | QTR AVG Liquidity | Sub Category | STAR Rating |
|---|---|---|---|---|---|---|---|---|---|---|---|
| AUSTRALIA | |||||||||||
| Equities - Broad | |||||||||||
| iShares S&P/ASX 20 ETF | ILC | 323.86 | -6.60 | 0.24% | 0.08% | 6.06% | 7.04% | 4.93% | 4.45% | Equity Australia Large Blend | 4 |
| BetaShares Aus Ex-20 Port Divrs ETF | EX20 | 22.93 | 8.73 | 0.25% | 0.17% | 8.84% | 18.20% | 2.09% | 25.74% | Equity Australia Large Blend | 3 |
| iShares Core S&P/ASX 200 ETF | IOZ | 1,286.08 | 510.71 | 0.15% | 0.06% | 7.59% | 11.60% | 3.61% | 20.01% | Equity Australia Large Blend | 5 |
| iShares S&P/ASX Small Ordinaries ETF | ISO | 82.34 | 8.82 | 0.55% | 0.31% | 13.43% | 19.30% | 2.01% | 8.60% | Equity Australia Mid/Small Blend | 3 |
| VanEck Vectors S&P/ASX MidCap ETF | MVE | 62.50 | 8.33 | 0.45% | 0.17% | 11.72% | 21.42% | 3.61% | 8.36% | Equity Australia Mid/Small Blend | 3 |
| VanEck Vectors Small Coms Masters ETF | MVS | 69.92 | 2.41 | 0.49% | 0.18% | 10.51% | 14.38% | 3.10% | 4.07% | Equity Australia Mid/Small Blend | 3 |
| VanEck Vectors Australian Equal Wt ETF | MVW | 422.23 | 74.01 | 0.35% | 0.08% | 9.46% | 15.54% | 3.01% | 12.65% | Equity Australia Large Blend | 4 |
| BetaShares FTSE RAFI Australia 200 ETF | QOZ | 319.25 | 28.54 | 0.40% | 0.10% | 7.29% | 11.27% | 3.91% | 15.26% | Equity Australia Large Blend | 4 |
| SPDR? S&P/ASX 50 ETF | SFY | 485.47 | 18.40 | 0.29% | 0.05% | 6.36% | 9.26% | 4.59% | 4.93% | Equity Australia Large Blend | 4 |
| SPDR? S&P/ASX Small Ordinaries ETF | SSO | 16.46 | 0.00 | 0.50% | 0.15% | 13.58% | 19.56% | 2.46% | 5.37% | Equity Australia Mid/Small Blend | 2 |
| SPDR? S&P/ASX 200 ETF | STW | 3,587.34 | 69.51 | 0.19% | 0.04% | 7.68% | 11.70% | 4.10% | 7.73% | Equity Australia Large Blend | 5 |
| Vanguard Australian Shares ETF | VAS | 2,661.32 | 78.65 | 0.14% | 0.04% | 7.68% | 11.81% | 3.44% | 7.31% | Equity Australia Large Blend | 5 |
| Vanguard MSCI Australian Large Coms ETF | VLC | 81.99 | 5.08 | 0.20% | 0.05% | 6.30% | 7.81% | 4.04% | 11.40% | Equity Australia Large Blend | 4 |
| Vanguard MSCI Australian Small Coms ETF | VSO | 140.71 | 22.00 | 0.30% | 0.10% | 11.89% | 17.99% | 3.59% | 10.26% | Equity Australia Mid/Small Blend | 4 |
| ETFS S&P/ASX 100 ETF | ZOZI | 8.66 | -2.10 | 0.24% | 0.19% | 6.98% | 10.75% | 4.73% | 12.01% | Equity Australia Large Blend | 3 |
| Equities - Sector | |||||||||||
| VanEck Vectors Australian Banks ETF | MVB | 28.39 | 1.19 | 0.28% | 0.08% | 2.63% | 4.51% | 5.56% | 11.55% | Equity Australia Other | 3 |
| VanEck Vectors Australian Resources ETF | MVR | 37.64 | 4.95 | 0.35% | 0.12% | 14.28% | 27.85% | 2.88% | 10.37% | Equity Australia Other | 3 |
| SPDR? S&P/ASX 200 Fincls EX A-REIT ETF | OZF | 72.72 | 10.53 | 0.40% | 0.10% | 0.97% | 2.07% | 4.86% | 18.96% | Equity Australia Other | 4 |
| SPDR? S&P/ASX 200 Resources ETF | OZR | 58.84 | 12.46 | 0.40% | 0.16% | 15.48% | 25.49% | 2.13% | 12.00% | Equity Australia Other | 3 |
| BetaShares S&P/ASX200 Fincls Sect ETF | QFN | 34.08 | 15.48 | 0.39% | 0.13% | 3.54% | 4.63% | 3.79% | 26.02% | Equity Australia Other | 3 |
| BetaShares S&P/ASX200 Res Sect ETF | QRE | 76.39 | 53.12 | 0.39% | 0.25% | 15.44% | 25.37% | 1.33% | 38.00% | Equity Australia Other | 3 |
| Equities - Strategy | |||||||||||
| iShares Edge MSCI Australia Mltfctr ETF | AUMF | 7.00 | 0.00 | 0.30% | 0.19% | 8.35% | 15.38% | 4.05% | 13.71% | Equity Australia Large Blend | 3 |
| BetaShares Managed Risk Australian Share | AUST | 26.50 | -6.52 | 0.49% | 0.12% | 7.13% | 9.62% | 4.01% | 8.72% | Equity Australia Large Blend | 3 |
| BetaShares Australian Eqs Strong BearHdg | BBOZ | 90.27 | 9.44 | 1.38% | 0.12% | -15.51% | -20.18% | 0.00% | 44.00% | Alternative Strategies | 3 |
| BetaShares Aus Equities Bear Hedge | BEAR | 55.93 | 4.31 | 1.38% | 0.11% | -6.74% | -8.69% | 0.00% | 16.23% | Alternative Strategies | 3 |
| UBS IQ Morningstar Australia Div Yld ETF | DIV | 28.31 | -1.77 | 0.30% | 0.18% | 8.35% | 11.88% | 3.89% | 3.96% | Equity Australia Large Growth | 3 |
| UBS IQ Morningstar Australia Quality ETF | ETF | 10.71 | -17.52 | 0.30% | 0.17% | 8.02% | 12.37% | 1.44% | 115.89% | Equity Australia Large Blend | 3 |
| VanEck Vectors S&P/ASX Franked Div ETF | FDIV | 3.94 | 0.01 | 0.35% | 0.16% | 7.16% | 5.89% | 5.32% | 8.67% | Equity Australia Large Blend | 3 |
| BetaShares Geared Australian Equity(Hdg) | GEAR | 60.66 | -13.24 | 0.80% | 0.11% | 15.68% | 21.45% | 6.16% | 53.57% | Equity Australia Large Geared | 3 |
| iShares S&P/ASX Dividend Opps ETF | IHD | 270.58 | 7.40 | 0.30% | 0.12% | 6.12% | 8.63% | 5.14% | 4.42% | Equity Australia Large Value | 4 |
| iShares Edge MSCI Australia Mini Vol ETF | MVOL | 6.74 | 0.00 | 0.30% | 0.14% | 7.05% | 11.81% | 4.43% | 1.49% | Equity Australia Large Blend | 3 |
| Russell Inv Australian Rspnb Inv ETF | RARI | 64.95 | -3.78 | 0.45% | 0.24% | 5.81% | 8.54% | 5.30% | 10.39% | Equity Australia Large Value | 3 |
| Russell Inv High Dividend Aus Shrs ETF | RDV | 294.50 | 3.95 | 0.34% | 0.08% | 5.86% | 9.50% | 5.41% | 3.54% | Equity Australia Large Value | 4 |
| Russell Inv Australian Value ETF | RVL | 13.53 | 0.00 | 0.34% | 0.08% | 8.23% | 5.77% | 4.41% | 2.88% | Equity Australia Large Value | 3 |
| BetaShares Australian Small Coms Sel | SMLL | 15.55 | 3.10 | 0.39% | 0.53% | 10.89% | 0.00% | 1.18% | 12.68% | Equity Australia Mid/Small Blend | 2 |
| Switzer Dividend Growth | SWTZ | 77.67 | 0.71 | 0.89% | 0.49% | 5.10% | 0.00% | 3.19% | 3.91% | Equity Australia Large Growth | Not rated |
| SPDR? MSCI Australia Sel Hi Div Yld ETF | SYI | 188.25 | -2.69 | 0.35% | 0.07% | 3.74% | 6.50% | 4.91% | 8.59% | Equity Australia Large Value | 4 |
| UBS IQ MSCI Australia Ethical ETF | UBA | 176.89 | -1.01 | 0.17% | 0.16% | 7.13% | 11.02% | 3.99% | 0.31% | Equity Australia Large Blend | 4 |
| Vanguard Australian Shares High Yld ETF | VHY | 1,034.98 | 82.48 | 0.25% | 0.06% | 3.63% | 9.87% | 6.76% | 5.98% | Equity Australia Large Blend | 4 |
| BetaShares Aus Top 20 Eq Yld Maxmsr | YMAX | 405.20 | -8.35 | 0.79% | 0.18% | 5.01% | 6.51% | 8.46% | 10.96% | Equity Australia Large Blend | 4 |
| ETFS S&P/ASX 300 High Yield Plus ETF | ZYAU | 43.68 | 14.26 | 0.35% | 0.19% | 4.08% | 12.43% | 9.95% | 15.24% | Equity Australia Large Blend | 2 |
| BetaShares Australian Div Harvester(mgd) | HVST | 272.72 | -71.36 | 0.90% | 0.10% | 1.64% | -9.07% | 11.23% | 15.94% | Equity Australia Large Value | 4 |
| K2 Australian Small Cap Fund | KSM | 16.55 | -2.02 | 2.70% | 1.25% | 8.66% | 19.98% | 9.61% | 5.19% | Alternative Strategies | Not rated |
| BetaShares Australian Sustnby Ldrs ETF | FAIR | 53.03 | 53.03 | 0.49% | N/A | 0.00% | 0.00% | 0.24% | 17.76% | Equity Australia Large Blend | 2 |
Source: ASX and Morningstar
Figure 43: Equity ETFs Global
| Name | Code | FUM ($M) | Qtr Flows ($M) | MER | Qtr Avg Spread | 3MTH Return | 12MTH Return | Historical YLD | QTR AVG Liquidity | Sub Category | STAR Rating |
|---|---|---|---|---|---|---|---|---|---|---|---|
| GLOBAL | |||||||||||
| Equities - Broad | |||||||||||
| iShares Global 100 AUD Hedged ETF | IHOO | 36.78 | 5.16 | 0.43% | 0.34% | 6.00% | 20.43% | 11.15% | 7.84% | Equity World - Currency Hedged | 2 |
| iShares Core MSCI World All Cap AUDH ETF | IHWL | 9.24 | 1.30 | 0.19% | 0.25% | 5.38% | 19.32% | 1.07% | 9.43% | Equity World - Currency Hedged | 2 |
| iShares Global 100 ETF (AU) | IOO | 1,338.17 | 18.09 | 0.40% | 0.12% | 11.97% | 23.26% | 1.92% | 3.43% | Equity World Large Blend | 4 |
| iShares MSCI EAFE ETF (AU) | IVE | 307.31 | 4.28 | 0.33% | 0.24% | 9.78% | 23.68% | 2.22% | 11.58% | Equity World Large Blend | 3 |
| iShares Core MSCI World All Cap ETF | IWLD | 20.23 | 5.04 | 0.16% | 0.26% | 5.62% | 12.68% | 1.45% | 10.45% | Equity World Large Blend | 2 |
| K2 Global Equities Fund (Hedge Fund) | KII | 20.33 | -2.21 | 2.70% | 1.37% | 6.49% | 18.22% | 0.00% | 4.04% | Alternative Strategies | Not rated |
| Magellan Global Equities | MGE | 980.89 | 36.48 | 1.35% | 0.42% | 6.51% | 14.19% | 1.65% | 3.38% | Equity World Large Blend | Not rated |
| Magellan Global Equities Currency Hdg | MHG | 63.10 | 4.87 | 1.35% | 0.57% | 6.30% | 22.99% | 1.63% | 4.37% | Equity World - Currency Hedged | Not rated |
| VanEck Vectors MSCI Wld ex Aus Qlty ETF | QUAL | 321.43 | 33.94 | 0.40% | 0.13% | 7.34% | 16.56% | 2.90% | 6.84% | Equity World Large Blend | 4 |
| UBS IQ MSCI World ex Australia Ethcl ETF | UBW | 25.29 | 0.98 | 0.35% | 0.22% | 5.73% | 13.12% | 1.77% | 5.82% | Equity World Large Blend | 2 |
| Vanguard All-World ex-US Shares ETF | VEU | 1,092.46 | 56.73 | 0.11% | 0.11% | 4.17% | 16.80% | 2.40% | 4.62% | Equity World Large Blend | 4 |
| Vanguard MSCI Index Intl (Hdg) ETF | VGAD | 374.13 | 45.43 | 0.21% | 0.08% | 5.52% | 19.95% | 4.85% | 10.70% | Equity World - Currency Hedged | 4 |
| Vanguard MSCI Index Intl ETF | VGS | 832.19 | 106.67 | 0.18% | 0.07% | 5.80% | 13.41% | 2.71% | 10.00% | Equity World Large Blend | 4 |
| SPDR? S&P World ex Australia(Hedged) ETF | WXHG | 79.39 | 3.35 | 0.35% | 0.23% | 5.50% | 20.10% | 2.83% | 4.28% | Equity World - Currency Hedged | 3 |
| SPDR? S&P World ex Australia ETF | WXOZ | 164.39 | 1.67 | 0.30% | 0.18% | 5.96% | 13.88% | 2.17% | 1.76% | Equity World Large Blend | 3 |
| Platinum International (Quoted Mngd Hdg) | PIXX | 124.97 | 82.46 | 1.10% | N/A | 6.55% | 0.00% | 0.00% | 31.50% | Equity World Large Blend | Not rated |
| Equities - Sector | |||||||||||
| BetaShares Glb Banks ETF-Ccy Hdg | BNKS | 73.72 | 14.77 | 0.57% | 0.26% | 4.98% | 18.71% | 2.05% | 15.26% | Equity World Other | 3 |
| BetaShares Glb Healthcare ETF-Ccy Hdg | DRUG | 24.42 | 2.20 | 0.57% | 0.31% | 0.65% | 17.56% | 0.30% | 10.73% | Equity World Other | 2 |
| BetaShares Glb Agltr Coms ETF-Ccy Hdg | FOOD | 17.37 | 3.65 | 0.57% | 0.32% | 5.51% | 16.07% | 1.05% | 22.06% | Equity World Other | 2 |
| BetaShares Glb Energy Coms ETF-Ccy Hdg | FUEL | 12.12 | 4.60 | 0.57% | 0.27% | 6.18% | 3.51% | 3.72% | 25.90% | Equity Global Resources | 2 |
| Market Vectors Gold Miners ETF | GDX | 63.62 | 1.17 | 0.53% | 0.34% | 1.51% | 2.89% | 0.64% | 5.69% | Equity Global Resources | 2 |
| Betashares Global Cybersecurity ETF | HACK | 55.61 | 8.00 | 0.67% | 0.26% | 5.83% | 9.39% | 2.48% | 16.79% | Equity Global Technology | 3 |
| iShares Global Consumer Staples ETF (AU) | IXI | 122.13 | -13.48 | 0.47% | 0.36% | 7.03% | 15.27% | 1.89% | 4.52% | Equity World Other | 3 |
| iShares Global Healthcare ETF (AU) | IXJ | 487.31 | -0.66 | 0.47% | 0.28% | 6.97% | 19.25% | 1.26% | 2.91% | Equity World Other | 3 |
| iShares Global Telecom ETF (AU) | IXP | 49.67 | 29.28 | 0.47% | 0.69% | 6.08% | 7.78% | 2.93% | 52.75% | Equity World Other | 2 |
| BetaShares Glb Gold Miners ETF-Ccy Hdg | MNRS | 5.29 | 0.00 | 0.57% | 0.48% | -0.29% | 1.61% | 0.44% | 22.92% | Equity Global Resources | 2 |
| ETFS ROBO Glbl Robotics and Atmtn ETF | ROBO | 44.84 | 40.54 | 0.69% | n/a | 7.56% | 0.00% | 0.00% | 69.27% | Equity Global Technology | 2 |
| Equities - Strategy | |||||||||||
| AMP Capital Dynamic Markets ETF (Hedge) | DMKT | 25.53 | 5.30 | 0.50% | 0.70% | 2.70% | 5.27% | 4.81% | 8.44% | Multisector Balanced | Not rated |
| BetaShares Global Sstnbty Ldrs ETF | ETHI | 126.39 | 27.97 | 0.59% | 0.23% | 6.06% | 0.00% | 1.31% | 15.28% | Equity World Large Blend | 3 |
| Schroder Real Return ETF | GROW | 45.25 | 2.42 | 0.90% | 0.48% | 2.14% | 4.56% | 2.54% | 4.15% | Multisector Balanced | Not rated |
| Market Vectors Morningstar Wide Moat ETF | MOAT | 51.40 | 0.41 | 0.49% | 0.28% | 5.52% | 12.86% | 0.90% | 11.55% | Equity North America | 3 |
| SPDR? MSCI World Quality Mix | QMIX | 7.26 | 0.00 | 0.40% | 0.28% | 6.89% | 13.27% | 2.25% | 3.80% | Equity World Large Blend | 2 |
| ETFS Morningstar Global Technology ETF | TECH | 29.25 | 13.98 | 0.45% | 0.33% | 6.12% | 0.00% | 0.84% | 22.15% | Equity Global Technology | 2 |
| SPDR? S&P Global Dividend ETF | WDIV | 161.12 | 12.40 | 0.50% | 0.20% | 5.16% | 8.84% | 3.96% | 9.67% | Equity World Large Value | 3 |
| iShares Edge MSCI World Multifactor ETF | WDMF | 23.54 | 4.98 | 0.35% | 0.45% | 7.09% | 17.89% | 4.40% | 10.71% | Equity World Large Blend | 2 |
| BetaShares Managed Risk Global Share | WRLD | 42.27 | -2.37 | 0.54% | 0.18% | 5.39% | 11.99% | 0.99% | 12.30% | Multisector Aggressive | 3 |
| iShares Edge MSCI World Minimum Vol ETF | WVOL | 12.40 | 0.00 | 0.30% | 0.46% | 5.44% | 8.87% | 2.49% | 4.68% | Equity World Large Blend | 2 |
| Montgomery Global Equities Fund (Managed Fund) | MOGL | 62.58 | 62.58 | 1.89% | N/A | 0.00% | 0.00% | 0.00% | 14.35% | Equity World Large Value | Not rated |
Source: ASX and Morningstar
IMPORTANT: This information is general advice only and has been prepared without considering your financial situation or objectives and you should consider if the information is appropriate for your circumstances before making an investment decision. Before acting on this information, please ensure that you read all relevant disclosure documents, including but not limited to, the Product Disclosure Statement (PDS) and Financial Services Guide (FSG). You may wish to speak to a financial advisor for further guidance. Numerical gures presented are accurate at the time of preparation and where required, further disclosure will be appropriately provided. Past performance cannot be relied upon for future performance. Information presented, gures quoted and diagrams are accurate as at 31 December 2017. Exchange listed managed funds are included in this report but not rated. Before making any investment decisions, please read the latest PDS provided by each ETF issuer and check all relevant ETF fees, as they are subject to change without notice.


Frequently Asked Questions about this Article…
The InvestSMART Australian Exchange-Traded Fund Quarterly Report aims to provide investors with an easy-to-understand overview of market activity and insights into how InvestSMART builds its Separately Managed Account (SMA) portfolios using ETFs.
ETFs are considered a low-cost investment option because they offer transparency, can be bought directly on the market, and typically have lower management fees compared to actively managed funds.
The InvestSMART Star Rating system evaluates ETFs based on key metrics such as size, fees, liquidity, spread, and tracking error. It provides a quantitative measure to help investors compare ETFs with similar objectives.
When choosing the best ETF for your portfolio, consider your current asset allocation, investment objectives, and use tools like InvestSMART's ETF Filtering Tool to identify suitable ETFs that align with your goals.
Active investment strategies involve fund managers actively selecting securities to outperform a benchmark, while passive strategies aim to replicate the performance of a market index. Passive strategies are often lower cost and suitable for investors who prefer a hands-off approach.
The Australian ETF market exceeded expectations, reaching over $35 billion in funds under management by the end of 2017, driven by inflows and strong performance in asset classes like commodities, equities, and property.
The total cost of an ETF includes the Management Expense Ratio (MER) and the bid-ask spread. Passive funds generally have lower MERs compared to actively managed funds, which aim to outperform benchmarks.
ETFs cover a wide range of asset classes, including commodities, currency, diversified sectors, equities, fixed income, and property & infrastructure. They offer diversification and can help fill investment gaps in your portfolio.


