How Krugman lost equilibrium
This article is the third piece in a four-part series. Read part one here and part two here.
Krugman’s explanation of our crisis today is straight from the pages of John Hicks’s 1937 explanation of the Great Depression (though curiously, Hicks himself didn’t mention the actual state of the global economy at all in his 1937 paper, which attempted to explain the relationship between interest rates, and real output in goods and services and money markets.
Firstly, the LM curve, (representing Liquidity Preference – Money Supply) is horizontal at the “zero lower bound”, since when nominal rate of interest reaches zero, there’s no point in buying bonds – it’s wiser to keep your money in cash. And secondly, during a Depression, private demand can fall so much that the intersection of IS (representing Investment – Saving) and LM occurs at a level of GDP well below the full employment level. The economy is in an equilibrium with involuntary unemployment (see figure 7).
Figure 1: Krugman's key graph in IS-LMentary (Krugman 2009)
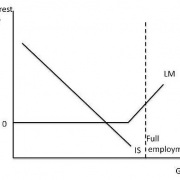
Krugman concludes that knowing the IS-LM model helps people avoid fallacies that afflicted a range of commentators who expected large government deficits to lead to higher interest rates, rampant inflation, and the crowding out of the private sector.
“IS-LM makes some predictions about what happens in the liquidity trap. Budget deficits shift IS to the right; in the liquidity trap that has no effect on the interest rate. Increases in the money supply do nothing at all,” he said.
“That’s why in early 2009, when the WSJ, the Austrians, and the other usual suspects were screaming about soaring rates and runaway inflation, those who understood IS-LM were predicting that interest rates would stay low and that even a tripling of the monetary base would not be inflationary. Events since then have, as I see it, been a huge vindication for the IS-LM types – despite some headline inflation driven by commodity prices – and a huge failure for the soaring-rates-and-inflation crowd.
“Yes, IS-LM simplifies things a lot, and can’t be taken as the final word. But it has done what good economic models are supposed to do: make sense of what we see, and make highly useful predictions about what would happen in unusual circumstances. Economists who understand IS-LM have done vastly better in tracking our current crisis than people who don’t.”
Sounds plausible? Yes, and there are some ways in which it is – as I often note, I frequently agree with Krugman even though I have a very different approach to economics. But now to show why his understanding and use of IS-LM is flawed.
Krugman’s IS-LM Errors
These are most easily seen in his post chiding Niall Ferguson, where he adds a little embellishment to figure 7 by extending his IS curve, effectively until it touches the dotted line representing full employment in Figure 7:
Figure 2: Equilibrium in the IS market occurs with a negative interest rate (Krugman on Ferguson in 2009)
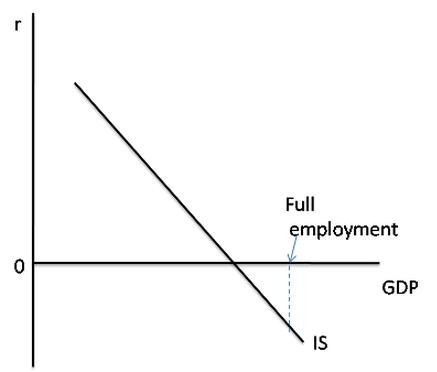
He then spells out what this means in the IS market in his next diagram: the demand for investment funds from firms-borrowers can only equal the supply of savings by households-savers if the interest rate is negative, but since the interest rate is actually zero, there is excess supply in the IS market: the intended supply of savings by households is greater than the actual demand for savings by investing firms.
Figure 3: Disequilibrium in the IS market because of the zero lower bound (Krugman on Ferguson in 2009)
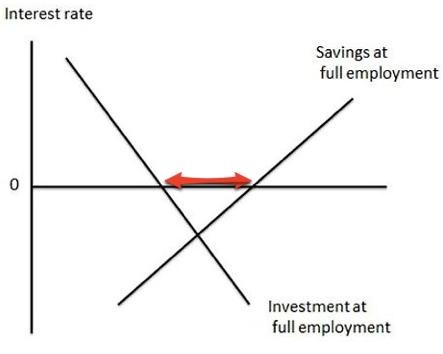
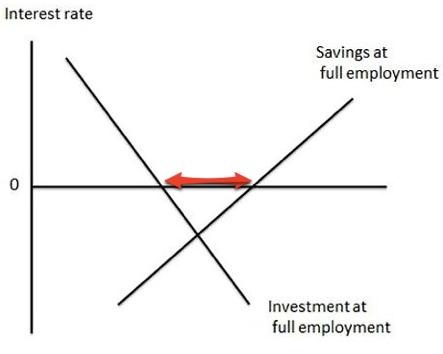
But since the interest rate can’t be negative (the nominal rate – the real rate can be with significant inflation, but of course we don’t have that right now), there is disequilibrium in IS market. Brad Delong emphasized this point by embellishing Krugman’s diagram (see figure 10).
Figure 4: Delong's embellishment (DeLong 012 in a “Department of Huh? criticizingme)
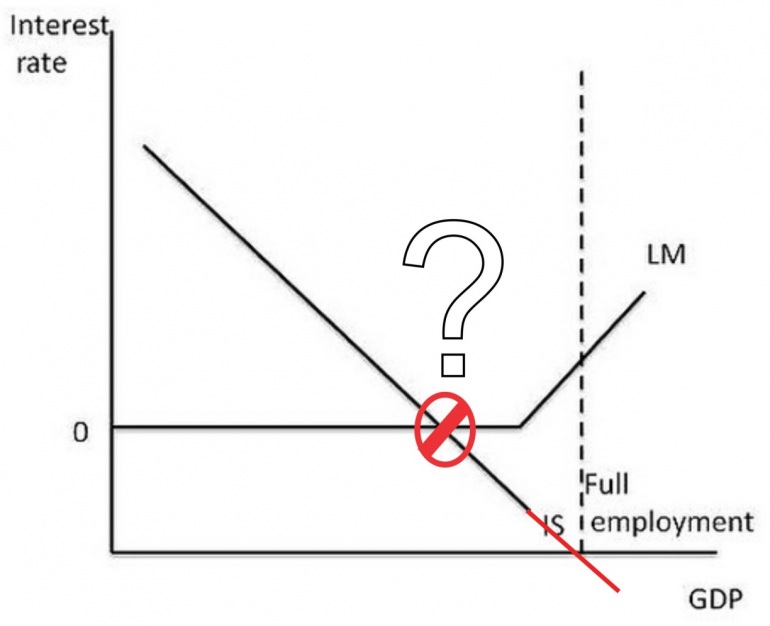
Now let’s feed that disequilibrium back into Figure 7. Krugman implied in that diagram that the economy was at the point where the IS and LM curves cross. But it can’t be – because at that point, the IS market is in equilibrium.So the economy has to be shown as NOT being on the IS curve.
Figure 5: The IS market is out of equilibrium so the economy can’t be on the IS curve (Krugman 2009, embellished)
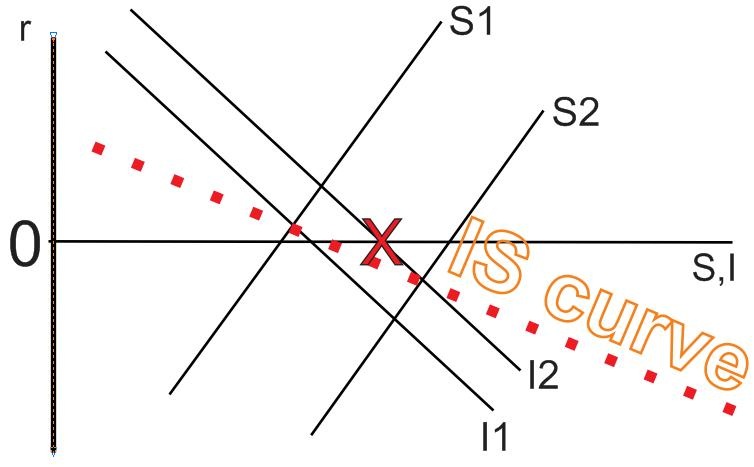
So where is it? Working with Krugman’s derivation of the IS curve (see figure 4 in the first instalment of this story), we can at least locate where the IS market is. Using S2 and I2 as the combination at which the market is in equilibrium only at a negative rate of interest – and therefore the market is in disequilibrium with an excess supply of savings because of the “zero lower bound” – the rule in disequilibrium is that “the short side wins”. Given the market price (in this case, zero), the point where the demand curve is at the market price is the amount that actually gets purchased. So it’s “X marks the spot” in figure 6 for the IS market.
Figure 6: IS market volume and price out of equilibrium
But that’s only half the model: where do we show this point on the LM curve? Could we perhaps locate the economy at some point along the LM curve, but not where it intersects the IS curve, as in figure 7?
Figure 7: First try: off the IS curve but on the LM?
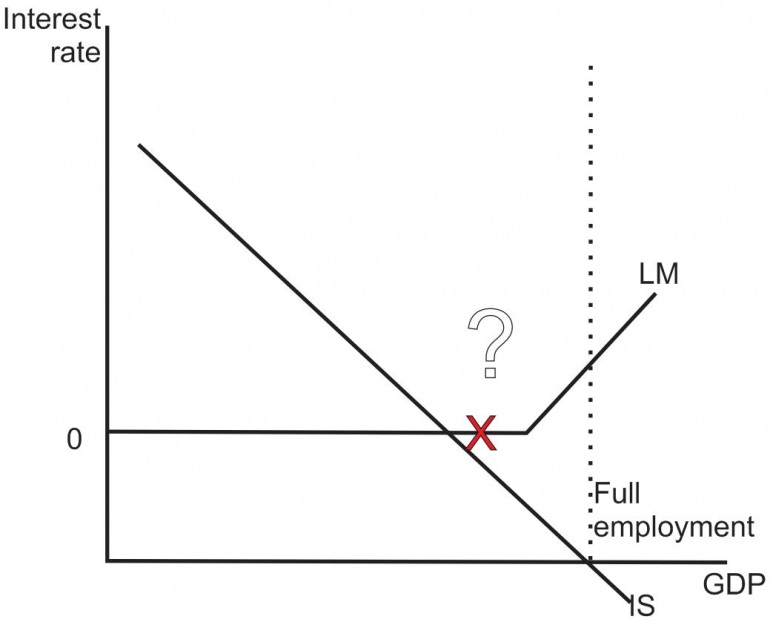
No, this won’t work either, because IS-LM is a “general equilibrium” model in Walras’s sense: if the IS market is out of equilibrium, then so must be LM.
Walras’ Law is normally used in an equilibrium manner by neoclassical economists, to argue that if one market in a two-market model is in equilibrium, then the other must be too. But it works in disequilibrium as well: if one market is out of equilibrium, then the other has to be as well. So not only can the economy not be where the two lines cross: it can’t be on either of the two lines at all.
Working with my drawing (figure 5 from the first instalment), since there’s excess supply in the IS market, there has to be excess demand in LM (by Walras’s Law). Since we know the interest rate (zero), I have to draw it somewhere that generates excess demand for money in the model – maybe at a point like X in figure 8.
Figure 8: LM out of equilibrium as well with excess demand
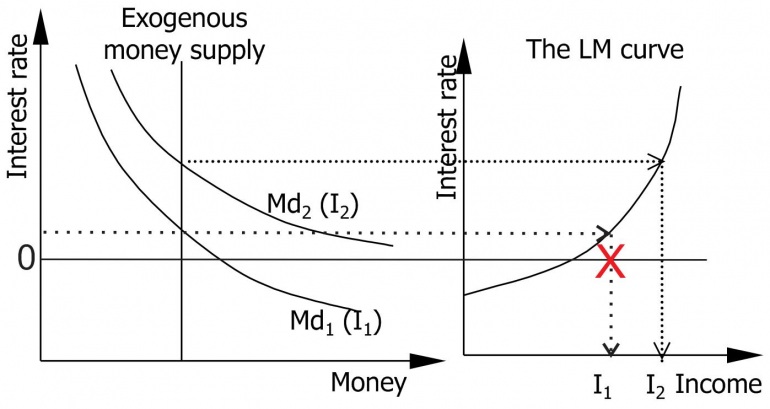
That would then mean that the actual economy was in a location like “X marks the spot” in figure 9 below – but that can’t be right either since we know the interest rate is zero, and X is below the zero mark.
Figure 9: IS-LM in disequilibrium?
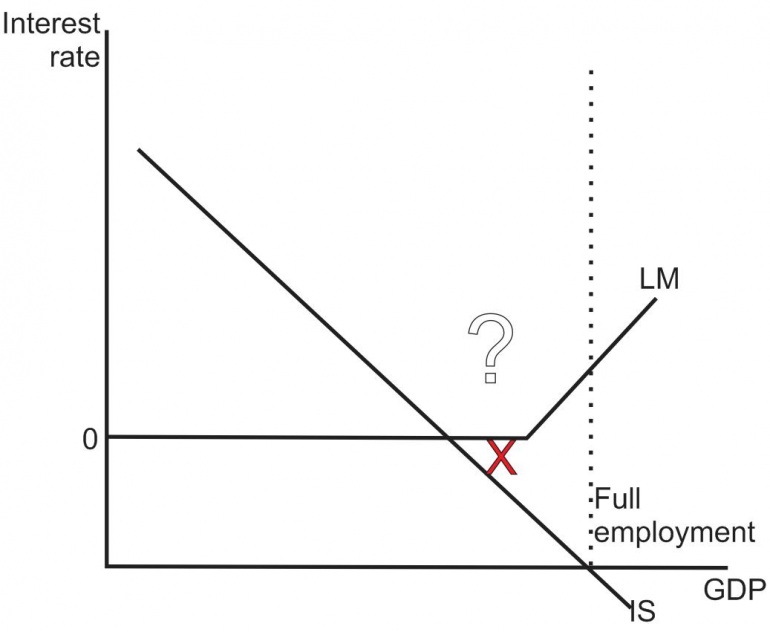
So where is the economy, in terms of the IS-LM diagram? It isn’t, as soon as you acknowledge that the economy is in disequilibrium, the IS-LM model can’t be used to represent it.
The concluding piece in this series will be published tomorrow.
Steve Keen is professor of economics & finance at the University of Western Sydney and author of Debunking Economics and the blog Debtwatch. His Minsky Kickstarter page is here.


