Have oil and industrial commodities bottomed?


Summary: In the US, energy and industrial commodities-related stocks soared last week, begging the question of whether the bullish journey has begun. My answer is no as spirit-sapping bear markets do not turn around on a dime. Well-known investors scooped up chunks of coal and industrial stocks but on the bearish side demand in China for energy and industrial commodities is a shadow of what it used to be. |
Key take-out: The good news of reversals is now battling the bad news of relentless bearish trends and given weak fundamentals from China I have to lean on the side of the latter. |
Key beneficiaries: General investors. Category: Commodities. |
Two opposing forces are clashing on the charts. One says bear markets need plenty of healing time before the bulls can run. The other says that every journey starts with the first step.
Last week, energy and industrial commodities-related stocks may have taken that first step. Everything from coal miners to industrial metals soared begging the question of whether the bullish journey has indeed begun.
My answer is no for the simple reason that spirit-sapping bear markets do not turn around on a dime. To me, the rebound is merely a reaction to a recent drubbing. These stocks dropped like rocks and as of Monday are mostly back to where they were at that time.
Billionaire investor George Soros targeted the coal sector, scooping up chunks of Arch Coal (ticker: ACI) and Peabody Energy (BTU) at fire sale prices. Did he know something about a recovery in industrial demand that the rest of us don't?
Even though he has already quadrupled his money on Arch Coal and that stock is up a jaw-dropping 900 per cent from its August bottom, let's put this in context. The stock is still down some 80 per cent since April 2014 when crude oil peaked before its own breakdown. And it is down almost 99 per cent from its 2008 energy bubble peak.
Technically, it is finally back to, but not through, its 200-day moving average for the first time since May 2014. That is not exactly a serious reversal of trend, at least not a proven one at this time.
Freeport McMoRan (FCX) is a better indicator for the entire energy/industrial complex. This copper and metals miner also had a big rally last week with a serious pick-up in volume (see Chart 1). It even sported a bullish divergence in its momentum indicators to make a good argument that conditions are much improved.
Chart 1: Freeport McMoRan
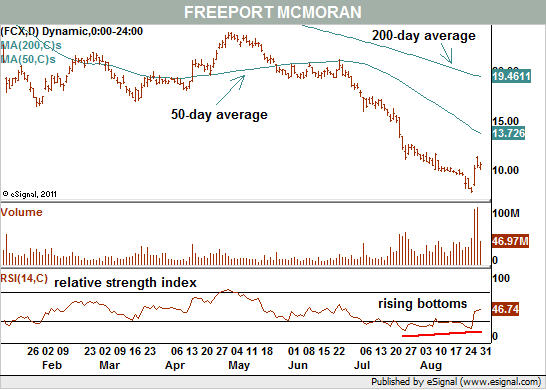
But we've seen this sort of rebound before. Freeport seemed to break out this past April and back then it had already formed a chart pattern to suggest internal preparation for such a move. In other words, it spent several months moving sideways and repairing the technical damage done over the course of a steep one-year decline.
However, the stock failed and never even made it back to its 200-day average. And today it is still below its 50-day average, which is the bare minimum traders want to have in place before switching to bullish strategies.
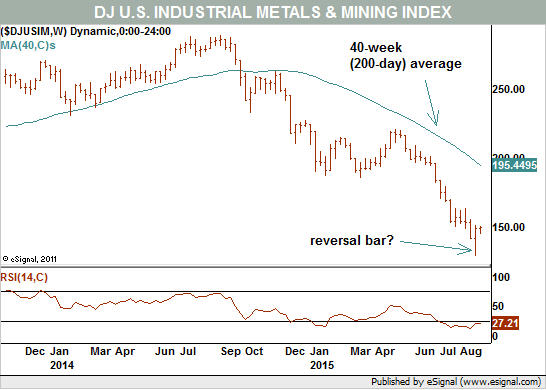
Back in June, I wrote that sinking industrial metals were a real problem for the stock market. I offered a chart of the Dow Jones US industrial metals industry group and it was already in a bear market.
Since then, it got worse and as we know the stock market fell after it. Therefore, I believe it is critical to continue to watch this index (see Chart 2). The best thing I can say about it is that it is oversold on a long-term basis and sports a bullish weekly reversal. But again, in context of the bear trend that began more than a year ago, all we can really say is that the potential for a bounce is there. Nothing has been confirmed on the charts at this time.
Chart 2: DJ US Industrial Metals & Mining Index
Let me take off my technical hat for a moment. On the bullish side we have George Soros involved in several coal stocks and Carl Icahn involved with Freeport McMoRan. But on the bearish side is a stumbling China where demand for energy and industrial commodities is a shadow of what it used to be.
To me, the former gains are stock specific while the latter is more of a sector-wide problem. After all, the rebound in the Market Vectors coal exchange-traded fund (KOL) looks nothing like the rip roaring rally in Arch Coal. And the oil and gas sector declines are a function of excess supplies and lower demand.
This brings us back to the original battle between a required drawn out healing process and a sharp rebound rally that could have marked to bottom. Let's use a chart of aluminium producer Alcoa (AA) to illustrate (see Chart 3).
Chart 3: Alcoa
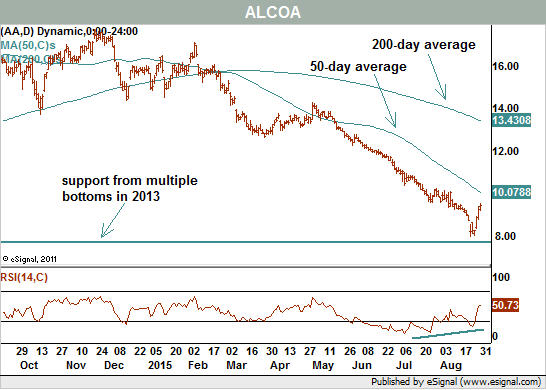
Alcoa fell from near $US18 a year ago to its current $US9.45. One week ago, it was trading just below $US8 so the overall loss was significant, to say the least. The short-term chart shows rising momentum bottoms, even as the price set a lower low. This is a sign that downside momentum is waning.
And on the long-term chart, last week's action left a bullish reversal at long-term support. All of that should make bulls hopeful but the trend is still down, on-balance volume is still falling and the stock is still below its 50-day moving average. It seems very unlikely based on the evidence that the tide has truly turned.
It would not be surprising to see short-term traders who rode the rebound take profits while demand dries up once again. That could lead to the healing of a bottoming pattern and put the stocks on stronger footing weeks or months down the road to mount a sustainable advance.
Again, for coal, metals and energy stocks, the good news of reversals and rising indicators is now battling the bad news of relentless bearish trends. With the weak fundamentals from China still looming I have to lean on the side of the latter. What these commodities-related stocks need to heal the damage done over the past year is time – and lots of it.
Michael Kahn, a longtime columnist for Barrons.com, comments on technical analysis at www.twitter.com/mnkahn. A former Chief Technical Analyst for BridgeNews and former director for the Market Technicians Association, Kahn has written three books about technical analysis.
This piece has been reproduced with permission from Barron's.


