Has value returned?


Summary: The market is still about 6 to 10 per cent overvalued on a price-earnings ratio basis. But the price to book ratio shows that even in a non-crisis state, the amount investors are paying for net assets is the same as in a crisis. Comparing stocks and bonds shows stocks have been undervalued for some time. |
Key take-out: The market currently looks bad but these measures show there is considerable value to be found. |
Key beneficiaries: General investors. Category: Shares. |
The recent rebound is encouraging but it's too early to say the correction is over. Markets go up, they go down, correct and rebound. This latest correction is best seen in that context as there was really no fundamental driver of it as I've outlined over recent weeks. The domestic and global economies are sound, strong even, and accelerating. Sure, the IMF has revised down its global growth forecasts, but realistically it's meaningless. Take out the bearish rhetoric that accompanies the downgrade and what you're left with is a global economy that is growing around trend over the next two years. The global expansion lives on.
So keep that in mind and keep this correction in context. The reality is, and since 2012 when I first started with Eureka Report, domestic stocks are still up nearly 50 per cent on an accumulation basis – a 14 per cent annual gain for each year (compounding). Financials are up something closer to 80 per cent.
You know what's really interesting though? It's that some measures of market value actually suggest stocks are as cheap as they were back in 2012. That's quite something.
Admittedly not all measures show this. In fact some suggest that compared to historical values, this correction hasn't really delivered value. The well-known price to earnings ratio for instance, is still above average on both a trailing and forward basis – roughly about 6-10 per cent overvalued, relative to historical levels, if you want to look at it that way.
Chart 1: Price to earnings have retreated, but…..
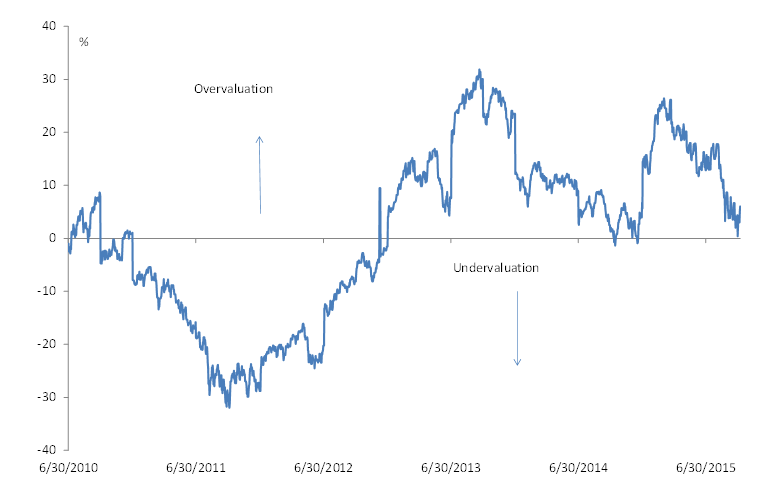
Back in 2012, the p/e ratio suggested stocks were 20-30 per cent undervalued.
Take a good look at the chart. As you'd expect stocks were very cheap during the hysteria surrounding the European debt crisis. The subsequent stock rally then saw equities shoot into ‘overvalued' territory on this measure, peaking between 20 and 30 per cent firstly in 2013 and then again earlier this year. Indeed since the European debt crisis calmed down some, stocks have spent virtually the whole period in overvalued territory – the average overvaluation at about 14 per cent.
In that context, stocks now are relatively cheap compared to the average p/e valuation in a post-GFC, non-crisis state. That puts stocks, on this measure, at the lower end of the post crisis range. So p/e ratios aren't back at 2012 lows, but there is also no US fiscal cliff or ‘Grexit' to contend with.
There are two other issues we need to keep in mind when we look at the p/e ratio.
One is that in looking at just the p/e of the market, we lose a lot of information. In part that is because earnings in the resource and energy sectors are distorting the headline figure – resource earnings are being hit by the commodity correction. This temporarily lowers the market earnings number used in the p/e ratio (and makes the ratio look larger than it would be) as commodity prices make that one-off adjustment.
So if you look at earnings multiples elsewhere you can get a sense of this. In the financials space for instance, stocks are very undervalued on a trailing basis and fairly valued on a forward basis (on what look to be fairly soft earnings forecasts). Some consumer stocks and the tech sector also look to be at fair value on a forward basis.
Which brings me to the second point. We must remember that in an ultra-low rate environment, we should expect p/e multiples to be above historical averages – well above. Indeed persistent overvaluation on a p/e basis should be the new fair value and we shouldn't blink at 10 per cent or event 20 per cent.
Other measures of value show stocks have cheapened considerably
Take the price to book ratio. This gives another idea of value by telling us how much investors are paying for the net assets of a firm. Like all other measures of value it's not perfect and has its flaws – it's just one more measure.
Chart 2: The price to book ratio suggests the market has much value
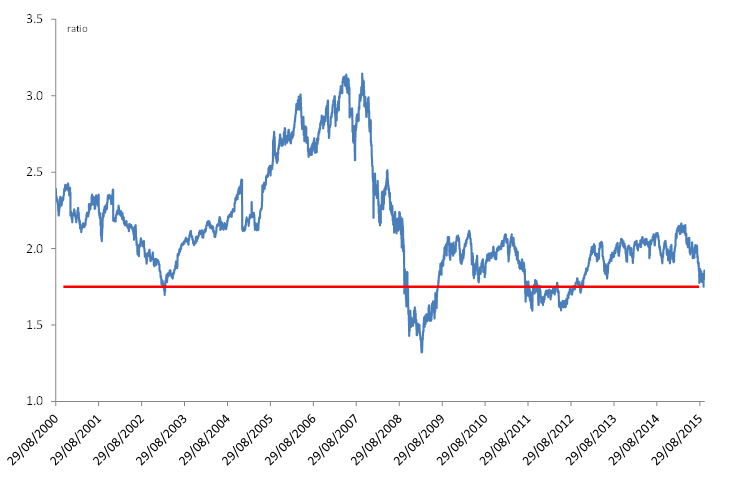
Chart 2 shows that we are looking at a price to book ratio that has really only been lower twice since 2000 – and that was during the GFC and then again during the Greek/European debt crisis. So we are in a non-crisis state, yet the amount investors are paying for net assets is the same as in a crisis. The chart also shows that investors were prepared to pay considerably more for these assets only six months ago! What's changed since then? Even the IMF admits, not much. If anything the Aussie economy is stronger, more resilient.
Chart 3: Stocks have cheapened further against bonds
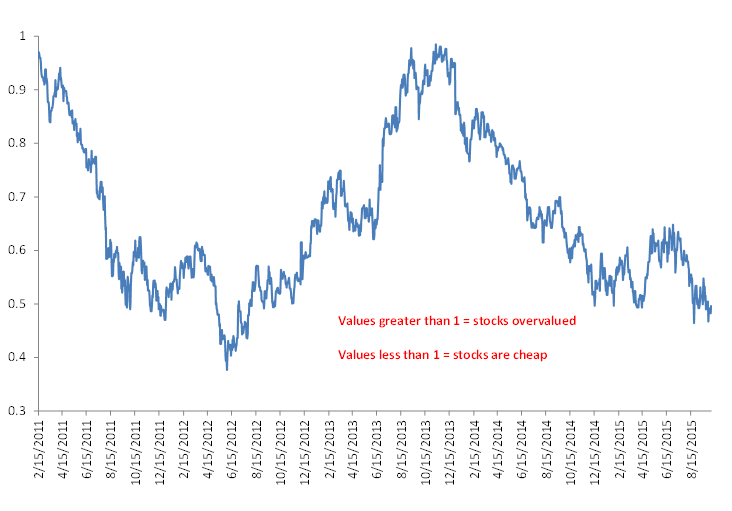
Another valuation tool that shows stocks as cheap they were in 2012 is the so-called BEER model. This measures the relationship between the 10-year Aussie government bond yields and the stock market's earnings yield (ASX200 in this case). Values greater than 1 suggest stocks are overvalued and less than 1 suggest undervaluation. Now obviously on this model, stocks have been undervalued for quite some time. But, once again, it's interesting to see that relative cheapness is back to – or close to – crisis levels, when there really is no crisis.
So what does that mean for this market? It means that there is considerable value. The market currently looks bad, granted – pessimism is extreme again. There is little to justify it though. Just rhetoric and a misunderstanding of the key macro drivers. Within that, it's important to note that the market never really breached the 5000 mark for any length of time. This remains a strong level of support and there's a message in that: there is a limit to just how far investors will push things to the downside. There is no growth collapse or global recession priced in here. So with value where it is, at some point a snap back is likely. The duration of this correction has been much longer than I thought it would be, true. But in the absence of any real crisis, I'm not sure what will sustain the market's current caution.


