Grid emissions decline slows, but petrol tapers
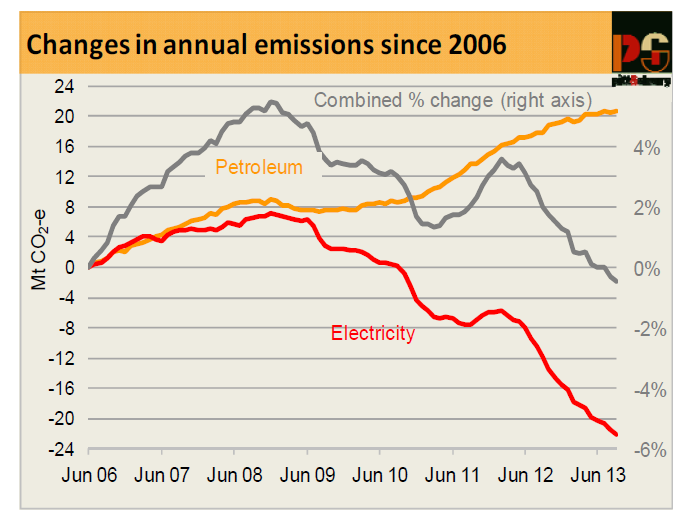
For the last two years, Cedex has been reporting each quarter a steady fall in emissions from electricity generation, while emissions from use of petroleum fuels continued to grow, offsetting about half the reduction in electricity generation emissions. Emissions from direct use of natural gas have hardly changed.
In this quarter’s Cedex Report we may be seeing the start of a change in this pattern. The rate of growth of petroleum emissions shows definite signs of slowing, while natural gas emissions show a sharp fall, as the decline in electricity emissions continues (Figures 1 and 2).
Total emissions for the year ended September 2013 were 2.1 million tonnes CO2-e lower than they were in the year ended June 2013 and 8.5 million tonnes lower than in the year to September 2012.
Over this annual period, electricity emissions fell by about 1.9 million tonnes CO2-e, a somewhat lower rate than over the preceding year. However, petroleum emissions increased by only 0.4 million tonnes CO2-e, also a lower rate than in the preceding period, while emissions from direct use of natural gas in the NEM state, i.e. excluding WA and the NT, fell by over 0.3 million tonnes CO2-e, a much larger quarterly change than any previously reported by CEDEX.
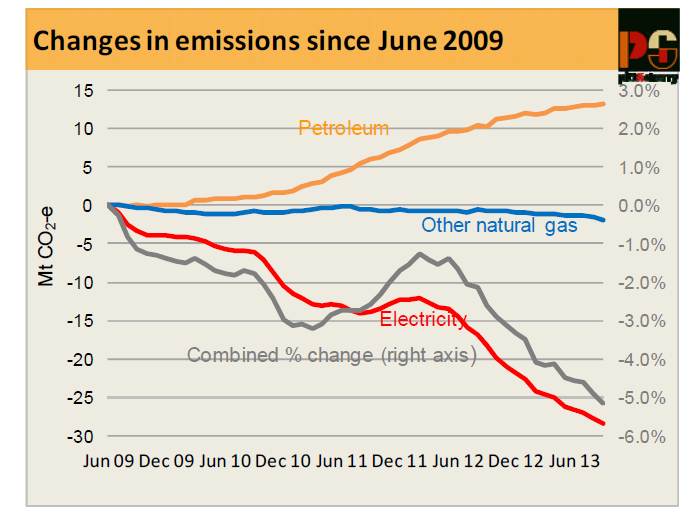
Since June 2009, which was close to the peak of Australian energy emissions, annual electricity emissions in the NEM have fallen by about 28 million tonnes and emissions from direct use of natural gas by almost 2 million tonnes CO2-e, while emissions from petroleum fuels have increased by about 13 million tonnes, making a net total reduction in annual emissions of around 17 million tonnes CO2-e, which is equivalent to about 5 per cent.
Petroleum
Cedex classifies petroleum products into four groups, characterised, in very approximate terms, by the types of activities for which the fuels are used. The four groups are:
• Light vehicle fuels, comprising all sales of petrol (mogas) and automotive LPG sales plus retail sales of diesel.
The name is a little confusing, in that some diesel sales to heavy vehicles are made through retail outlets, but it is certain that virtually all of this fuel consumption is for road transport.
• Bulk sales of diesel, most of which are used for mining, agriculture, railways, shipping and electricity generation at remote locations, and some for road transport (buses, road transport fleets).
• Aviation fuels, including both domestic and international aviation.
• Other fuels, consisting mainly of relatively small quantities of LPG and heavy fuel oil, none of which is used for road transport.
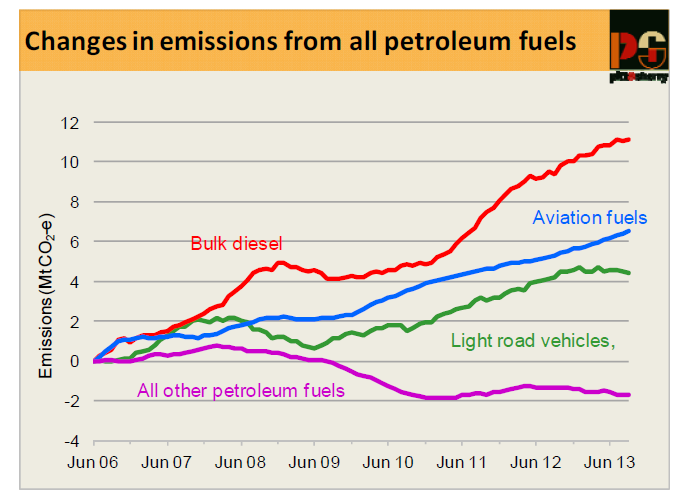
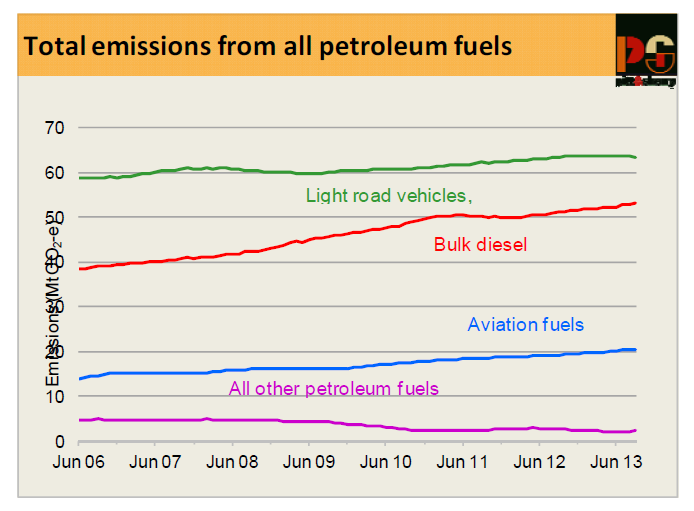
Figures 3 and 4 show how sales of these four groups of petroleum fuels have changed over the past seven years.
This year there has been almost no growth in sales of light vehicle fuels, which previously occurred only during the financial crisis. Moreover, the first nine months of the year are also showing a gradual decrease in the rate of growth of consumption of bulk diesel. Consumption of aviation fuels continues to grow strongly. Light vehicle fuels continue to account for the largest share of total consumption. The combined effect of these trends is a slowing in the total rate of growth of emissions from use of petroleum.
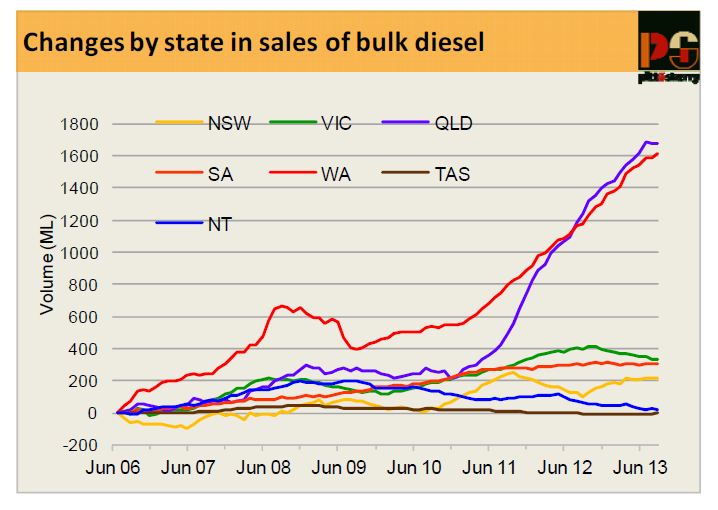
Growth in bulk diesel consumption continues to be driven by Queensland and WA, presumably linked, in particular, to mining and mining related construction activities. While growth in total consumption is gradually slowing, this can be attributed more to the stagnation, or actual decreases, in sales being experienced in all other states (Figure 5).
The apparent cessation of growth in consumption of light vehicle fuels is probably a more significant development, suggesting that at last the gradual shift towards smaller and more fuel efficient cars may be beginning to have a discernible effect on Australia’s transport fuel consumption and associated greenhouse gas emissions. Could this be an historic turning point, of the kind we have been seeing in electricity consumption?
Natural gas
At least as important as the zero growth in road transport fuel consumption is the decline in consumption of natural gas. This is the most decisive fall in consumption since gas consumption data was first included in Cedex and, indeed, since natural gas first became available to Australian energy users in the late 1960s.
Patterns of natural gas consumption (excluding use for electricity generation) vary considerably between states.
In Queensland, major industrial users, such as chemical plants and alumina refineries, account for the majority of consumption, with very little residential consumption. In NSW and SA, residential consumption accounts for about a quarter of the total, with the remainder being spread between a wide range of commercial and industrial consumers. In Victoria residential consumption, mainly for space and water heating, is half the total consumption.
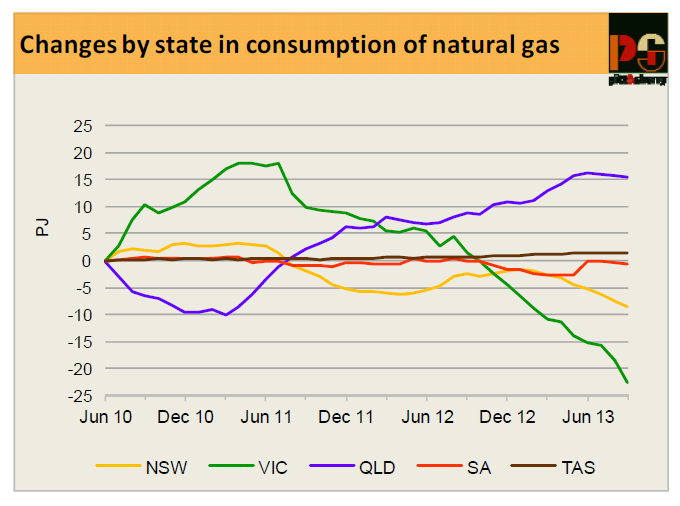
Victorian consumption as a whole is just over 45 per cent of total consumption of natural gas in eastern Australia, having declined from over 50 per cent only a year ago. That rapidly falling consumption in Victoria is driving the total decline is clearly seen in Figure 6. It might be thought that the recent mild winter has been a major contributor to this fall in annualised consumption, but the data show that the decrease started over two years ago, though it may have accelerated in recent months. This pattern suggests that there may be parallels to the decrease in electricity consumption which Cedex has been reporting for several years. More detailed analysis has shown that the decrease has been particularly large amongst residential consumers (see below).
Finally, it is important to recognise that regular, up to date data on the quantities of gas used in upstream gas production and processing activities are not publicly available, that these quantities are already quite significant, and that the quantities will increase dramatically when the LNG export plants in Queensland come on stream.
National Electricity Market update to November 2013
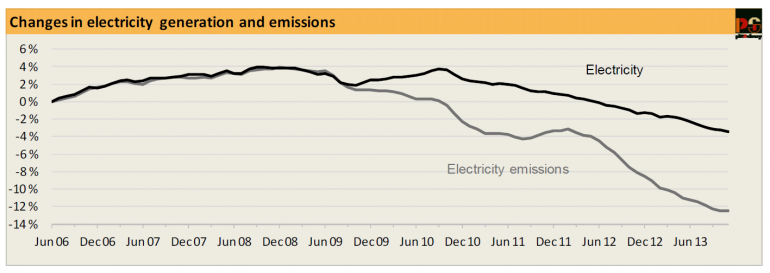
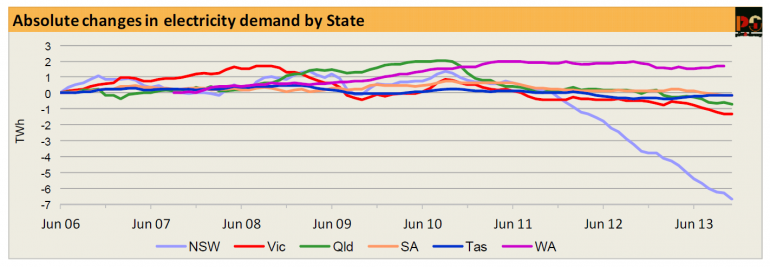
Data for electricity supply and consumption in the NEM up to the end of November 2013 show that, while annualised consumption continued to fall, there was a slowdown in the rate of fall in emissions (Figure 7). The fall in annual consumption, compared with the year to November 2012 was 4 TWh, equivalent to just over 2 per cent, a rate of annual demand reduction which has been fairly constant for over two years. The fall in emissions, compared with one year ago, was 8.5 Mt CO2-e, equivalent to exactly 5 per cent. It is now five years since both annual electricity demand and total annual emissions from generation in the NEM reached their historical maxima. The total fall in demand over those five years has been 14 TWh, equivalent to 7 per cent, while the total fall in emissions has been 30 Mt CO2-e, equivalent to almost 16 per cent.
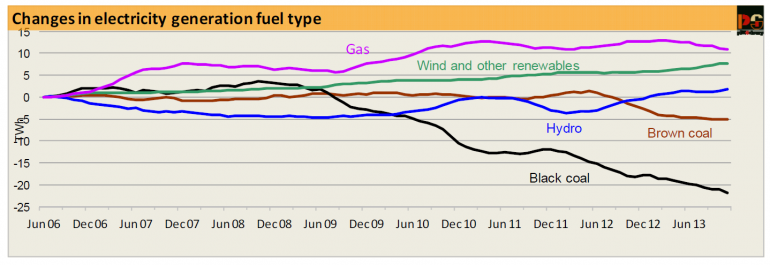
The reasons for the slightly slower rate of emissions reduction since the last Cedex can be seen in Figure 8. Black coal and gas generation fell, but brown coal generation was unchanged. Both hydro and wind generation increased, but did so more slowly than in recent months. The inter-regional flows of electricity within the NEM show the combined effects of market behaviour very clearly. Annual net exports from Tasmania to Victoria continued to increase, as Hydro Tasmania seeks to maximise the financial benefits it gains so long as a price on emissions remains in place (and it has stored water available). In turn, exports from Victoria to both NSW and SA also increased, reflecting the competitive advantage provided by the very low short run marginal cost of brown coal generation.
The much higher cost of black coal outweighs the relatively small cost advantage which black coal generators gain from the carbon price. Net exports from Queensland to NSW have decreased considerably, but are still positive.
The effect on NSW generators is quite severe. In the last few months the NSW government owned Macquarie Generation’s two big power stations, Bayswater and Liddell, have averaged about 60 per cent and 45 per cent loads only, respectively, while Eraring, now owned by Origin Energy, has been averaging less than 40 per cent and Vales Point B, also owned by the state government through Delta Electricity, has been averaging about 60 per cent. Overall, however, this represents little change in total coal fired generation over the past year. In Queensland, annual coal generation has fallen by nearly 9 per cent over the past year. Major state government owned power stations Tarong, Callide C and Stanwell have been operating at about 30 per cent, 45 per cent and 65 per cent respectively, while the state’s newest coal fired power station, Kogan Creek, is currently out of service having a solar pre-heating system for boiler feedwater added.
The renewed consumption decrease, particularly evident in NSW, may well be a consequence of the recent mild winter. NSW uses a higher proportion of electricity for space heating than Victoria and SA, which make more use of gas. Across the whole NEM, as previously noted, residential electricity consumption has been a major driver of falling total demand. This is shown very clearly by data released by the ABS in recent weeks for Queensland, NSW and Tasmania (data for the other states is promised before the end of the year). In the two years from 2009-10 to 2011-12, average electricity consumption per customer (household) fell by 7.6 per cent in Queensland, over 11 per cent in NSW and over 17 per cent in Tasmania. The consequence of these dramatic consumption changes, calculated from data in another ABS publication, is that across Australia as a whole average annual household expenditure on electricity has barely increased, in real terms. Specifically, from 2009-10 to 2011-12, the real average price of electricity increased by 17 per cent but average total annual expenditure increased in real terms by only 2.4 per cent. More recent data, for 2012-13, published by the two Queensland network businesses and by Ausgrid in NSW, show that the decline in household electricity consumption continued strongly, and perhaps even accelerated, in the most recent year.
Given the duration and size of these consumption reductions, it seems unlikely that people are, metaphorically, “freezing [or boiling] in the dark”, as some of our more excitable political leaders would have it. They are much more likely to be adopting simple and well known energy saving behaviours, and buying and using newer, and much more efficient appliances, including televisions, refrigerators and air conditioners.
This is the latest report on Australia's energy emissions from pitt&sherry.

