Four reasons why this rally may have legs


Summary: There are four reasons why this rally could continue: The volatility index is falling. The US Federal Reserve looks increasingly unlikely to lift interest rates this year. Historically, October tends to be a strong month for the market. Some measures of value suggest the market is as cheap as it was in 2012. |
Key take-out: Sentiment has been a key driver of market pull-backs but it appears sentiment is now starting to shift. |
Key beneficiaries: General investors. Category: Shares. |
The million dollar question is whether this is finally the end of the correction – the most severe since 2011. The signs are good, in the sense that the market has rallied in eight of the last eleven sessions. That's a total gain of 3.78 per cent for a daily average gain of 0.4 per cent – 0.8 per cent if you exclude the 3.8 per cent slump on September 29.
As I've outlined over recent weeks there are plenty of reasons why this rally should continue – on the fundamentals, at least. But then again, looking at the fundamentals isn't going to tell us when the next correction is going to occur or whether it's finished. That's because the fundamentals are very positive and that hasn't changed.
Sentiment is the key and that's been the case for some time. For years now it's been a case of fundamentals driving the rallies, and sentiment – or a distorted sentiment, hysteria even – driving the pull-backs. That's not any different this time.
Chart 1: The fear gauge is falling
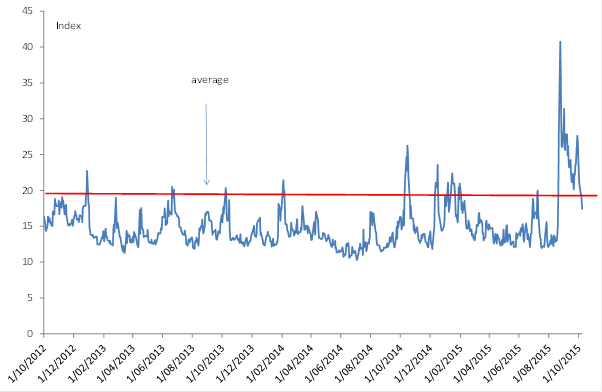
So as far as sentiment goes there are some very encouraging signs. Firstly, we are seeing a marked fall in the VIX index, shown in chart 1 above. Recall that this is known as the market's fear gauge. Higher values suggest market angst is high, while lower values show that markets aren't as concerned. With that in mind, the fear gauge has come down markedly of late and is currently below the post-GFC average.
That's reason number one as to why this rally may have legs.
That decline may or may not come down to the second support factor for sentiment: The Fed. Now as regular readers know, my call from last year was that the Fed wouldn't be tightening in 2015. They haven't to date and now markets and economists are increasingly of the view that the Fed won't hike this year at all. To be honest, I'm starting to wonder whether 2016 is iffy.
Anyway, the minutes to the US Federal Reserve's meeting last week made it clear that the Fed isn't in the mood for tightening. It's all in this paragraph:
“Inflation continued to run below the Committee's longer-run objective, partly reflecting declines in energy prices and in prices of non-energy imports. Market-based measures of inflation compensation moved lower; survey measures of longer-term inflation expectations remained stable. Participants anticipated that recent global developments would likely put further downward pressure on inflation in the near term; compared with their previous forecasts, more now saw the risks to inflation as tilted to the downside.”
The Fed has a dual mandate. While the unemployment rate is plummeting, inflation is low. On that basis, they can hold for as long as inflation remains low and doesn't look like it'll lift back to target – which it isn't currently. Indeed the Fed reckons that the strong dollar is restraining inflation, while also acting as a drag on net exports – it's lowering growth, in their view.
It's that combination that gives them ample scope to leave rates on hold and I suspect they will. That of course is a boon to equities – at the very least the market doesn't have to worry about how a rate hike will affect bond yields and stocks until next year – maybe.
The third reason why the rally could continue has to do with some seriously solid seasonals. October tends, historically, to be a strong month for the market. On average, the S&P/ASX200 normally lifts 4 per cent (5 year average) in the month. Twelve days into it and we're already up 4.2 per cent.
That's then historically followed by a small dip in November and then five months of gains after that. The average monthly gain from December to April is about 1 per cent per month. Now these are averages only and seasonals are just that. Not a guarantee that the market will punch higher, just the historical tendency.
Assuming the Fed doesn't hike, and that there isn't some other event out of left field, some of the technical indicators are a good guide as to whether these seasonalities might operate again this year. The first test for the market is actually quite close. Take a look at the below chart.
Chart 2: A key test is whether the ASX200 can break through key resistance
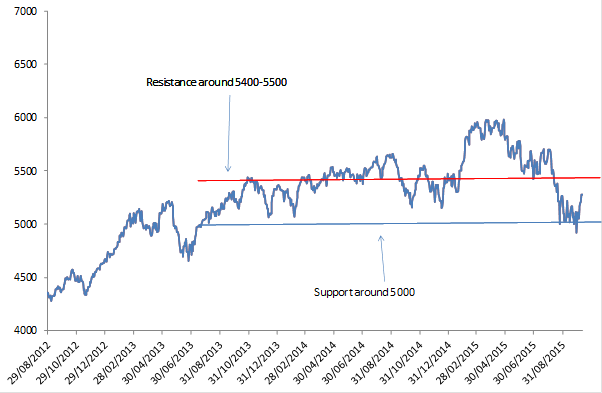
Lines of support and resistance are a very simple technical measure. As you can see from the chart, three is a red line of resistance around the 5400-5500 mark. At the time of writing the ASX 200 was only 5 per cent away from that. If there is a solid break through, then that's a good signal that the rally has legs.
On other, more advanced measures, such as the relative strength index which gives a signal as to whether something is overbought or oversold, the fact that the market is nowhere near overbought territory is also positive.
The fourth reason for a continued rally is one I highlighted last week, so I won't spend too much time on it (see Has value returned?, October 7). Basically, some measures of value have the market as cheap as it was back in 2012. At the very least no one is making the case that the market is expensive. It was that claim that got in the way of the market earlier in the year.
Now of course if the Fed does for some reason hike, that will change things. As discussed though, that isn't looking likely this year – and it's not clear that the market would sell off in any case. It would all depend on the execution of that rate hike. If the Fed is smart about it the market could actually rally, assuming that is a policy response they want.


