European QE: Buy the rumour, sell the fact?


Markets have been waiting a long time for tonight's European Central Bank announcement on quantitative easing. From a stock trader's perspective, it should be an interesting night. The German stockmarket index – the Dax -- will be keenly watched, in part because it's such a liquid market.
QE certainly has the potential to support stock market valuations. You only have to look at Japan for evidence of this. In addition, the weakening euro will help German exporters who will at the same time benefit from cheaper commodity input prices. So confirmation of a big QE plan certainly has potential to bring cheer to the German stock market. However, that doesn't look like a guaranteed outcome and, interestingly, the decision comes at a time when the Dax is parked at significant chart resistance.
To begin with there's a real possibility of a ‘buy the rumour, sell the fact' reaction. Markets seem increasingly certain of a €500bn or greater QE package. To date, the Dax has already rallied 9 per cent from its January 6 low, leaving plenty of scope for profit-taking to set in after the announcement.
Then there's plenty of scope for the QE announcement to disappoint. Many believe that it might not be enough given the size of Europe's economy. It might take something much bigger to really excite the market.
Finally there's also real doubt about the effectiveness of QE for Europe. The reasons for this have been much discussed but a couple of the main ones include:
- Europe is late to the party with QE and both consumers and businesses are jaded by central bank policy. This package won't have the ‘shock and awe', confidence-inspiring impact that something earlier in the cycle may have done. After a protracted period of low growth, confidence is weak and there's limited demand for credit. Slightly lower rates from already low levels might not make much difference.
- Lending channels in Europe rely much more on banks than corporate bonds and bank lending is being limited by the need to bolster capital requirements.
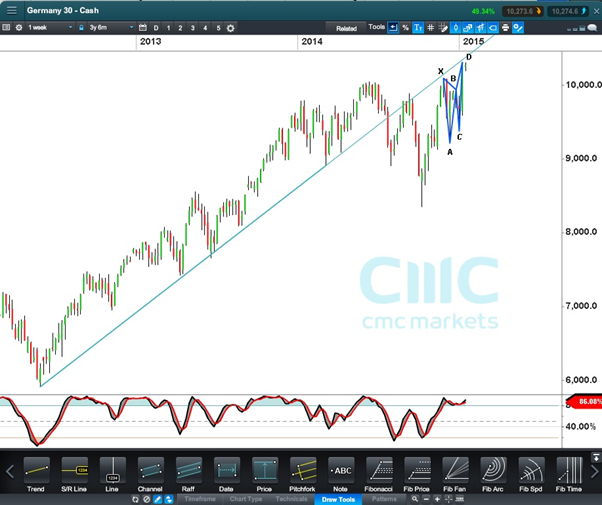
So how does all this tie in with the Dax chart below? One fairly obvious feature is the trend support line that defined the uptrend, neatly holding all the minor corrections for a two-year period from mid-2012. As often happens, once this line was decisively broken it has started to act as resistance. The market has now run up under this resistance for the third time.
For harmonic-pattern traders, a really interesting feature of this chart is the emergence of a potential butterfly reversal pattern (see wings on the chart below). This pattern is yet to be completed but relies on the final leg finishing close to a set of Fibonacci projections. For the purist these projections are that the move from A to D will be about 127 per cent of the move from ‘X' down to ‘A' while the move from ‘C' to ‘D' will be 127 per cent of ‘A' to ‘B'.
If the Dax starts to fall away from current levels (or a bit higher) it will have completed a butterfly pattern and failed at the trend line yet again, leading chart followers to expect a good chance of lower prices to come.
Ric Spooner is chief market analyst at CMC Markets. @ricspooner_CMC


