Does Dynamic Asset Allocation stack up?


Summary: Strategies and funds that dynamically change asset allocation promise a lot, but the evidence isn't encouraging they reliably deliver. |
Key take-out: Just as there is debate between the merits of picking investments inside an asset class, so will there be debate about the merits of timing moving money between asset classes. |
Key beneficiaries: General investors. Category: Shares. |
Dynamic asset allocation strategies and funds, interchangeably described as tactical asset allocation, offer great promise.
Rather than manage an investment portfolio to a static, fixed, strategic asset allocation mix of assets, these strategies (herein noted as DAA) change the mix of portfolio assets based on changing investment market conditions and expectations about future returns.
The perfect DAA strategy is supposed to pull you out of equites before a market crash and put you back in at the market bottom, thereby offering more returns for less risk and volatility. After the launch of Australia's first multi-asset, dynamically allocated DAA exchange-traded fund (ETF), it is worth trying to answer if this strategy and funds built to employ it actually work?
DAA funds available to investors
DAA funds are difficult to characterise. My guess is there about 10 or so funds (Figure 1) available to retail Australian investors. More funds may say they are, but this might be an overzealous marketing department at work rather than just me miscounting. Closely related funds might be called objective-based funds targeting a certain outcome or retirement date objective, and multi-idea funds, which are closer to hedge funds, speculating on the prices of multiple assets, currencies and commodities.
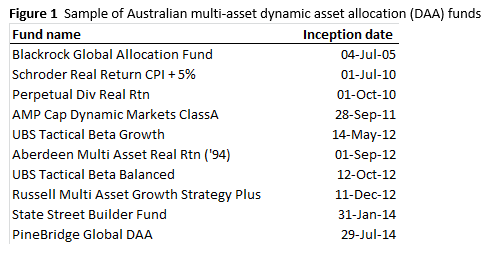
The longest running DAA fund in Australia is the Blackrock Global Allocation Fund available to Australian investors since 2005, but started for US investors in 1995. By targeting a nearly fixed 60 per cent allocation to equities (mostly trading on the US share market) it might be fair to say it is partially practising DAA.
While Aberdeen's local Multi-Asset Real Return Fund has technically served Australian investors since 1994, until September 2012 it did so as a traditional boring fixed allocation, multi-asset growth fund. It was retooled and made sexy!
AMP's DAA fund operating since 2011 has recently become available as an ETF under the trading symbol DMKT making it the first multi-asset DAA fund and possibly the first multi-asset ETF.
Asset re-allocation
Figure 2 shows the asset allocation mix of these three funds over the last four-plus years. These charts are fascinating, although yes, confusing to look at. The key thing to see is that the percentage mix to various, mostly traditional, assets changes a lot. With a traditional multi-asset (some might wrongly call a “balanced fund”) the mix doesn't change much. It would only drift slightly before rebalancing, perhaps every six months, if it were a statically run fund. If actively managed, the equity/bond mix would stay within much tighter tolerances and sub-asset types wouldn't come and go.
Figure 2: Dynamically changing asset allocation mix of the Aberdeen Multi Asset Real Return fund (top), AMP Capital Dynamic Markets Fund (middle) and Blackrock Global Allocation Fund (bottom) over the last 4, 5 and 21 years respectively.
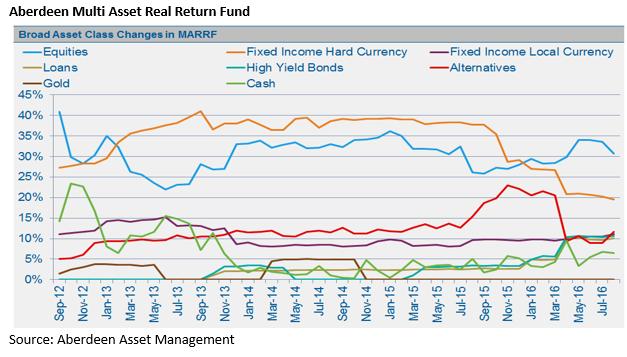
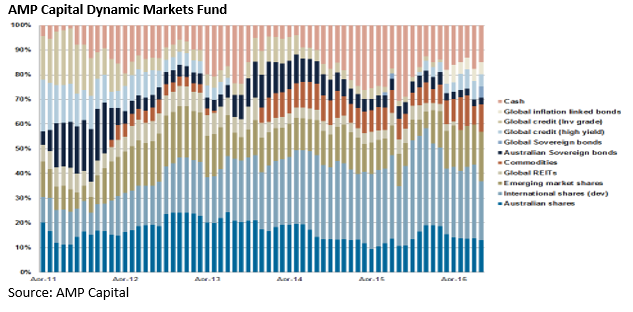
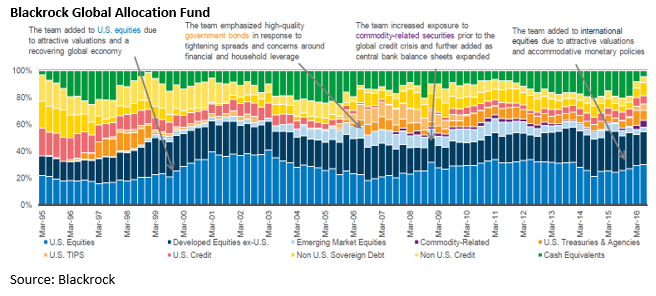
These figures show that in the last four years, Aberdeen's mix of equities ranged from a low of 22 per cent (in mid-2013) to a high of 42 per cent (late 2012). AMP's equity mix changed from a low of 30 per cent (early 2012) to a high of 65 per cent (early 2013). You can't accuse these two funds of inactivity, nor copying each other.
On the other hand, Blackrock's total equity allocation has largely held firm at 60 per cent. In fact, since 2000, or for 15 years, it hasn't really moved much – including through the GFC. Despite having a “go-anywhere, flexible investment approach” the fund investment approach seems to be only dynamically adjusting the composition of a nearly rigid 60 per cent mix of equities and 40 per cent mix of bonds/non-equities. You can see this from the bottom of the chart where the total of the three blue shaded bars (US equities, ex-US developed market equities and emerging market equities) largely add up to 60 per cent.
In all three funds, cash has ranged from nearly nil to about 20 per cent.
Do they perform?
It is difficult to judge the performance of funds given the short track record of the locally designed funds (excluding the nearly 60 per cent fixed-equity Blackrock fund which has been around longer), differences in objectives and appropriate benchmarks.
Nevertheless, Figure 3 shows the ranked annualised returns from seven of the 10 funds operating over the 3.5 years from February 1, 2013 to September 30, 2016 – the start date chosen to enable comparison of most funds. These are shown compared to the returns from the median performing “Balanced” and “Growth” style fund ranked by researcher Morningstar and index funds from Vanguard. These hold roughly 50 and 70 per cent equities, which broadly bounds the equity mix (target or observed range) of some of these funds and would be expected to deliver the CPI 5 per cent target of others.
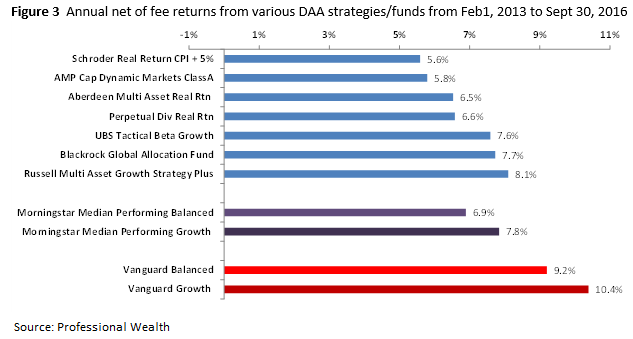
Before you jump (too early) on the band wagon that active managers don't perform, realise the impressive returns from the static index Vanguard funds result from their 50 per cent (Balanced fund) and 30 per cent (Growth fund) allocation to mostly sovereign bonds, which have recently rallied. As pointed out in my recent article, The inherent risks of index investing, these funds now own bonds yielding about 2 per cent locked in for nearly a decade – and soon a small proportion of Australia's first 30-year bond launched on Tuesday. I think active and very active (DAA) funds are doing you a favour minimising those holdings, which should show up in the future as better returns. They and I could be wrong, of course.
That aside, it's not immediately apparent from comparing DAA fund returns that they did that much better than returns from actively managed but more traditional, mostly static strategic asset allocation funds, as evidenced by the Morningstar benchmark returns.
In fact, over a longer nearly six years, the four operating funds from Aberdeen, Schroder, Perpetual and Blackrock returned 6.1, 6.2, 7.3 and 8.1 per cent annually (respectively), of which only two of four are between the 6.6 to 7.1 per cent for the median performing Balanced and Growth fund, respectively (and far short of 8.4 and 9.3 per cent for Vanguard).
Figure 4 shows rolling annual returns of funds compared over the last 3.5 years reported in Figure 3. It reveals quite significant variation in relative returns over time. For instance, Aberdeen underperformed for the first five months, later finishing as top performer in the last 12 months – that's great for new investors in the fund in the last three years. AMP was a top performer until lagging in the last 6 months (just when launching their ETF perhaps). Schroder is highlighted because perhaps you can see it offered the most stable returns (along with Perpetual) – its annual volatility of returns is about half of others. The most volatile was UBS. Vanguard Growth started with the biggest annual return and hid in the top of the pack for most of the return – doing not much!
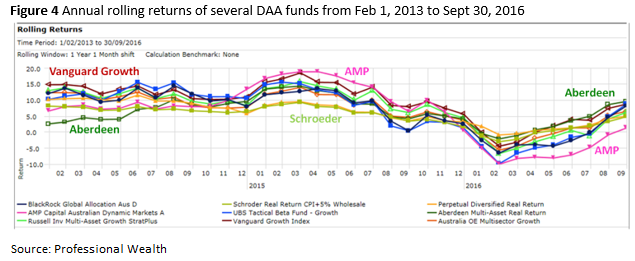
This chart shows there is some luck in picking a DAA fund, depending on when they are hot or not. This is not surprising. We showed in Figure 2, even with a small sample, funds adopt quite different asset allocations.
Some will be right, some will be wrong, and it's hard to be right all the time. DAA is hard to do!
Overseas experience
Surprisingly the academic and popular research hasn't written a lot about DAA or TAA funds. However it's fair to say many are sceptical about beating the market this way.
In the US, researchers at Morningstar weren't convinced when they studied this sector in late 2010.
In the first study researcher Jeffrey Ptak found of the 62 funds studied that were at least three years old, only 13 notched up superior returns to a 60/40 equity/bond benchmark index fund. Of the 30 funds studied that were one to three years old, only nine beat the benchmark. Rather than just beat a buy and hold approach, it was hoped that at least DAA funds could offer some portfolio insurance – that is fall less in a downturn, like in the GFC. Sadly, they found 42 of 62 suffered maximum drawdowns worse than the benchmark fund.
Ptak summarised: “We found scant evidence that rapid-fire trading enhanced results-- portfolio turnover averaged more than 200 per cent among the tactical funds we analysed, most of which didn't distinguish themselves. High fees didn't help, either …. These results reinforce our belief that tactical allocation is no panacea: A long-term, fundamentals-based approach is important to success”.
In the follow up study Morningstar noted: “In extending our study of tactical mutual funds through Dec. 31, 2011, we found that tactical funds generally struggled to deliver competitive risk-adjusted returns when compared with a traditional balanced fund. With a few exceptions, they gained less, were more volatile, or were subject to just as much downside risk as a 60 per cent/40 per cent mix of US stocks and bonds”.
Other anecdotes offer, when practising DAA, that you can be out of an asset class years before it corrects and back in too early after the initial fall. This was true of the GFC for some investors and might be again for those betting on sovereign bond prices collapsing.
Fees and expenses impact
Perhaps DAA does add some value, but the modest and inconsistent amounts are eaten up in higher fees and expenses. Management fees, where performance fees aren't charged, average about 1 per cent. Base fees, where performance fees exist, are less: 0.2 and 0.5 per cent for Blackrock and AMP's funds, for instance, but you'll also have to give up 12.5 per cent of absolute, or 15 per cent relative above CPI 4.5 per cent, returns respectively. Given high turnover, this fund or strategy would only be appropriate for nil or lightly taxed investors, those probably investing in super.
Just as there is an unresolved debate between the merits of actively picking and avoiding investments inside an asset class, so will there be debate about the merits of timing the buying and selling of different asset classes (DAA). While I want to say DAA can work, and may at times be necessary, my investigation here is far from supportive.
If you “go to cash” worried about high share market or bond price-earnings ratios, I guess you are technically practising your own version of dynamic asset allocation. However, I think for some this is a risk management exercise - intending to avoid loss.
If you are confident you can forecast future returns and dynamically allocate between assets, then good luck to you.
With the rise of so many specialist ETFs you never have had so many tools available to implement your vision. Just take care!
Dr Douglas Turek is principal advisor with family wealth advisory and money management firm Professional Wealth.
Please note financial products referred to here are for educational purposes and do not constitute an investment recommendation. Do your own research or contact a licensed financial advisor before investing.


