Coal generation and electricity demand coming back?
*National Electricity Market update, to September 30
This issue of the Carbon Emissions Index (Cedex) update continues the trend of increasing emissions from electricity generation (Figure 1), as coal generation begins to grow back, hydro generation retreats, and both gas and wind generation also fall slightly (Figure 2).
Total annual emissions from generation in the NEM were 1.3 per cent higher in the month to September 2014 than they were in the month to June 2014. As explained in the last update, this change in trend has coincided with, but is not entirely caused by, the removal of the carbon price. Other factors include reduced gas generation in NSW, Victoria and South Australia, presumably related to higher wholesale gas prices, though it remained high in Queensland where cheap 'ramp gas' is likely to be available for a little longer. There was also considerably less wind generation in both August and September this year, compared with the same months in 2013.
Black coal generation was 0.5 per cent higher in the year to September 2014 than in the year to June, and brown coal generation was 2.2 per cent higher.
Figure 1
Figure 2

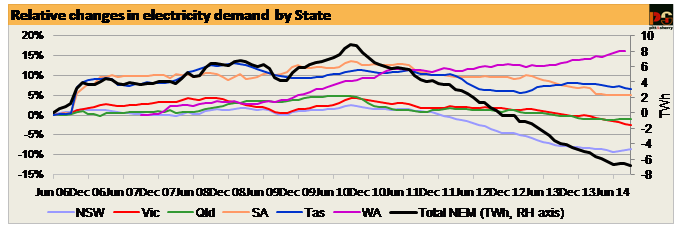
A change in trend may also be emerging on the demand side (Figure 3). Total annual NEM demand has fallen more slowly over the past three months than it did up to last June. Demand is actually increasing in both NSW and Queensland, and is almost completely flat in SA. Demand is falling in Victoria, but if the effect of the Point Henry aluminium smelter closure is removed from the data, demand is on the rise there also. It appears that only in Tasmania is demand for electrical energy continuing to fall. Outside the NEM, demand in Western Australia continued to increase in the year to August. While it may be tempting to identify the response of electricity consumers to lower prices, post carbon price, as the reason for the growth in demand, this is by no means certain.
Residential demand, in particular – less than a third of total demand – has until recently been falling much faster than demand by other consumers, and has been doing so at a rate which cannot be convincingly explained as solely a response to higher prices. The data suggest that households have been changing their attitudes to electricity consumption and, hence, to their consumption behaviour (much as they changed their attitudes and behaviour to water consumption during the drought of a few years ago).
We may now be seeing signs that this attitudinal effect has run its course. On the other hand, irrespective of clear political uncertainty and possible policy changes, it is certain that installation of small-scale rooftop PV will continue to grow, eroding demand for centralised electricity supply through the NEM as it does.
Figure 3

To end, we have two graphs showing wind generation and pool prices in SA and Victoria from Saturday, September 27 to Wednesday, October 1 inclusive.
This interval was characterised by two periods of significantly above average wind speeds across southeast Australia, sandwiched between three low wind periods.
The inverse relationship between wind generation and pool prices is very clear – the more wind generation, the lower the price, on average.
In addition, in SA there were several periods when wind generation was greater than total state NEM demand: briefly on Saturday afternoon, for much of Sunday, and again – most strikingly – between about 9.30am and 6pm on Tuesday, a normal working day.
'True' demand by consumers on that day (i.e. the amount of electricity being used by consumers) was in fact considerably higher than NEM demand – up to 20 per cent, according to the Australian Photovoltaic Institute – because of the contribution of rooftop PV to total electricity supply. During this period all of the thermal power stations in SA were shut down, with the exception of the two units at the coal-fired Northern Power station, each of which ran at about 60 per cent of full load, and one of the four units at the gas-fired Torrens Island B station, which was running at about 25 per cent of full load.
Considerable volumes of electricity were exported to Victoria. In simple arithmetic terms (though not, of course, in how the grid actually operated) the state’s electricity supply was 100 per cent renewable while coal- and gas- fired electricity was exported.
Figure 4

Figure 5
This is the latest Carbon Emissions Index report on Australia's energy emissions from pitt&sherry. Data analysis, text and graphs: Hugh Saddler, Hannah Meade and Mark Johnston.


