Bursting with bank stocks


Summary: Financial companies dominate the ASX200, with 37.56 per cent of the market capitalisation coming from this sector. Investors should keep track of their exposure to bank stocks, but this is made difficult for those exposed through index funds, managed funds and LICs, because it is not always easy to see holdings in the latter, while the former could provide more exposure than investors by mirroring the sector weightings of the index. |
Key take-out: The banking sector presents its own risks, even though the Australian banking sector is well regulated and has a strong track record – investors should make sure they are comfortable with their levels of exposure both through individual share ownership and index funds and other managed investments. |
Key beneficiaries: General investors. Category: Shares. |
Much has been written about the end of the mining boom in Australia. Less, however, has been written about the way the end of the boom has changed the shape of the Australian share market – that has for so long dominated by mining and banking companies.
There was a time, not that long ago, that saw BHP as the biggest company listed on the ASX200, worth more than 10 per cent of the value of the market by itself. Now BHP is the only mining company among the ASX200's top 10, with a market weight of less than four per cent. The dominant company now is Commonwealth Bank, worth a little under 10 per cent of the ASX200. Westpac, ANZ, Telstra and National Australia Bank follow this in size. Our ‘Big 4' banks make up four of the biggest five listed companies in the Australian market.
In terms of the overall market (ASX200), Australia is dominated by financial companies, with 37.56 per cent of the market capitalisation from this sector. Materials are the next biggest sector (12.7 per cent), worth less than one third of the value of financial companies.
How much does market make-up mean to individual investors?
Investors who allocate some of their portfolio to index funds understand what they have in their portfolio – a collection of investments in the same proportion as those investments existing in the index. Knowing what is in their portfolio is less transparent for an investor who chooses an ‘active' managed investment, like a Listed Investment Company (LIC) or managed fund.'
As an exercise to look “under the bonnet” of some more actively managed Australian share portfolios, the Australian Share holdings of two large fund managers (BT and Colonial) and two large LICs (AFIC and ARGO) have been chosen, and their top 10 holdings compared with the top 10 holdings in the ASX200 index at the end of February with these investment managers.
Table 1 – top 10 Holdings – index and managed investments
Index (End Feb) | Colonial First State Australian Shares (End November 2015) | ARGO (End February 2016) | BT Wholesale Core Australian Share Fund (End February 2016) | AFIC (End February 2016) |
CBA 9.4 per cent | CBA 11.03 per cent | Westpac 6.9 per cent | Westpac 8.6 per cent | CBA 13.4 per cent |
Westpac 7.5 per cent | Westpac 8.61 per cent | Telstra 4.9 per cent | ANZ 7.0 per cent | Westpac 10.7 per cent |
ANZ 5.2 per cent | CSL 5.81 per cent | CBA 4.9 per cent | CBA 7.0 per cent | Telstra 6.6 per cent |
Telstra 5.04 per cent | ANZ 4.56 per cent | ANZ 4.8 per cent | Telstra 5.2 per cent | Wesfarmers 6.5 per cent |
NAB 5 per cent | Transurban 4.21 per cent | Wesfarmers 4.6 per cent | CSL 4.4 per cent | NAB 5.8 per cent |
BHP 3.9 per cent | BHP 4.19 per cent | Macquarie 3.3 per cent | QAN 4.4 per cent | BHP 5.3 per cent |
CSL 3.8 per cent | NAB 3.90 per cent | NAB 3.2 per cent | Macquarie 4.2 per cent | Transurban 5.0 per cent |
Wesfarmers 3.45 per cent | Macquarie 3.88 per cent | BHP 2.9 per cent | NAB 3.5 per cent | ANZ 4.5 per cent |
Woolworths 2.38 per cent | Henderson 3.70 per cent | Milton 2.6 per cent | Amcor 3.2 per cent | Amcor 4.1 per cent |
Scentre Group 1.83 per cent | Aristocrat 3.67 per cent | Australian United Investments 2.5 per cent | 21st Century Fox 3.1 per cent | CSL 4.0 per cent |
The bottom line is that each of these portfolios bears more than a passing resemblance to the index portfolio – especially in terms of exposure to bank shares. Given the propensity for people to have a mix of managed investments and direct shares, and given the popularity with individual investors of holding some direct bank shares, it is easy to see how the already high weighting of bank shares in the overall market could be even higher in an individual's portfolio.
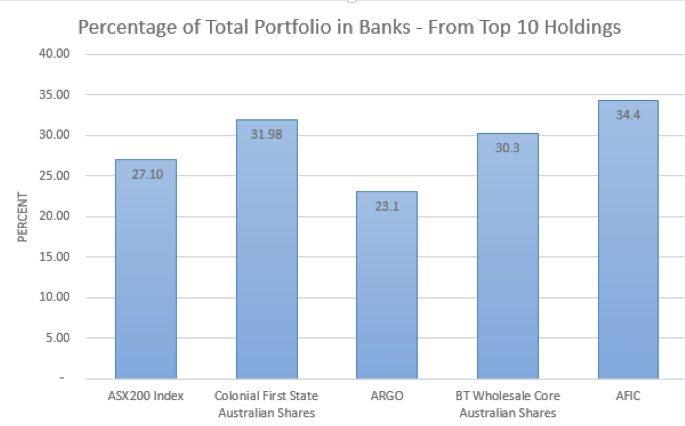
Further to this, the following graph considers the top 10 holdings in the index and then each fund, looking at what proportion of their overall portfolio is held in banking shares from these top 10 holdings. It is interesting to note that ARGO is the only managed investment that has a smaller weighting to bank shares in their top 10 than the index.
The question is, to what extent should any investor be concerned about their exposure to Australian banking companies?
The risks of bank exposure
On face value, having high levels of exposure to Australian banks does not seem like such a bad thing. The Australian banking system seems to be well regulated, it has been a long time since any failures in the Australian banking system and the banks themselves continue to pay attractive fully franked dividends on the bank, off years of increasing profitability and current multi-billion dollar profits.
However, investors are also acutely aware of the systematic stresses that banks can face around funding, as seen during the Global Financial Crisis. Banks are not simple businesses, and the banking system is not a simple system. Fear around the reputation of a bank, or the banking system, can cause significant losses in wealth for investors.
Often investors think that a strong flow of dividends is a proxy for investment security. In some cases it can be – if companies are paying dividends out of a reliable earnings stream with costs, including interest costs, well covered by borrowings. I don't think that banks, even with their strong dividend streams, should be considered in this category.
The decision for Australian investors is to decide what level of portfolio exposure that they are comfortable with in banks – and make sure that they understand the total exposure from both their own direct bank holdings and any managed investments that they own.
Conclusion
The weighting of banks in the Australian market (37.56 per cent) is about twice that of banks in the global share market of developed countries (excluding Australia – using a Standard and Poor's Index) (18.47 per cent). It is possible that individual portfolios have exposure beyond this. The Global Financial Crisis provides a reminder of the risks of banks as investments. These risks, and the high weighting of banks in the Australian market, suggest that we as investors should be checking that we are comfortable with our exposure to bank shares in our portfolios.


Frequently Asked Questions about this Article…
The Australian share market is heavily dominated by financial companies, with 37.56% of the ASX200's market capitalization coming from this sector. This dominance is due to the significant size and influence of major banks like Commonwealth Bank, Westpac, ANZ, and National Australia Bank, which are among the largest companies listed on the ASX200.
To assess your exposure to bank stocks, you should review both your direct shareholdings and any managed investments like index funds or LICs. Index funds typically mirror the sector weightings of the index, which means they may have a high exposure to bank stocks. Managed funds and LICs may not always provide clear visibility into their holdings, so it's important to look 'under the bonnet' to understand your total exposure.
Investing in Australian bank stocks carries risks despite the sector's strong regulation and track record. Banks can face systematic stresses, such as those seen during the Global Financial Crisis, which can impact their profitability and investor wealth. Additionally, while banks offer attractive dividends, they should not be solely relied upon as a proxy for investment security.
It's important for investors to be aware of their bank stock exposure because the Australian market has a high weighting of bank shares, which can lead to overexposure in individual portfolios. Understanding your exposure helps you manage risk and ensure that your portfolio aligns with your investment goals and risk tolerance.
The exposure to bank stocks in the Australian market is significantly higher than in global markets. In Australia, banks make up 37.56% of the market, whereas in the global share market of developed countries (excluding Australia), banks account for only 18.47% of the market.
Investors should consider their risk tolerance, investment goals, and the overall composition of their portfolio when deciding their level of exposure to bank stocks. It's crucial to understand both direct and indirect exposure through managed investments and to ensure that the level of exposure aligns with their comfort level and financial objectives.
While dividends from bank stocks can be attractive, they should not be solely relied upon as an indicator of investment security. Dividends are beneficial when they come from a reliable earnings stream, but banks, despite their strong dividend streams, face complex risks that can affect their stability and investor returns.
The end of the mining boom has shifted the shape of the Australian share market, which was previously dominated by mining companies like BHP. Now, financial companies, particularly banks, have taken a more dominant role, influencing the overall market composition and investor exposure.


