Blue skies ahead
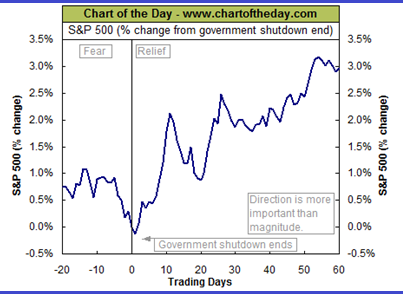
| Summary: The United States is open for business again, with its debt crisis pushed back – albeit for a few months. If history is any guide, the market should enjoy a relief rally over the next 60 trading days. |
| Key take-out: Using a market trend-trading tool, investors can buy when the stock index (All Ordinaries) moves above its trend line and shift to a cash management account when the index falls below the line. |
| Key beneficiaries: General investors. Category: Economics and strategy. |
On 12 of the previous 17 occasions when the US government shutdown, the S&P 500 share index stock enjoyed a relief rally over the ensuing 60 trading days (almost three months). That’s why stock analysts are now bullish.
Others believe the huge global rally in share prices over the past year is merely a result of low interest rates caused by weak economies, propped up by central bank money printing. In their view Australia’s outlook is better than most, but its relatively tight monetary policy could see our dollar float higher undermining industry competiveness.
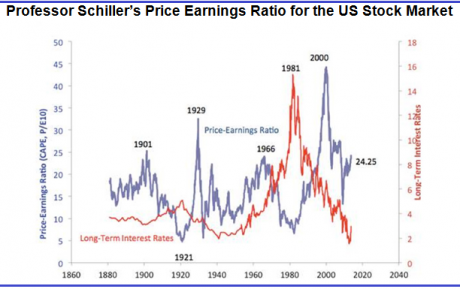
Value investors are also of the opinion that America’s sharemarket is overvalued (based on Professor Shiller’s famous P/E ratio) and so is its bond market (as demonstrated by historically low bond rates).
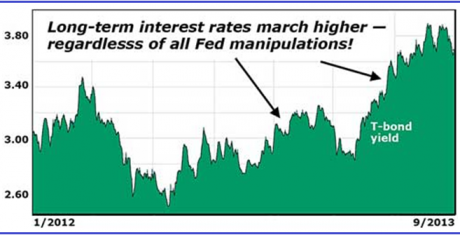
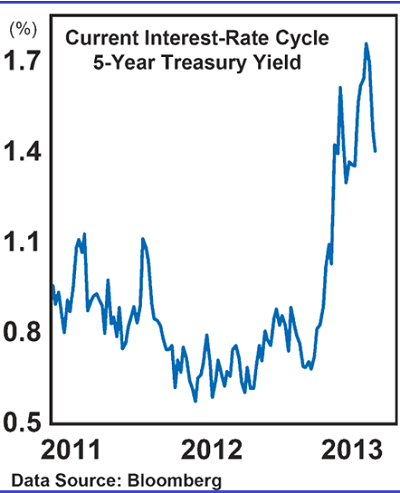
US long-term bond rates have increased since April, though it’s hard to say whether this is just another blip in their downward march since 1981 or the first move in a new upward cycle.
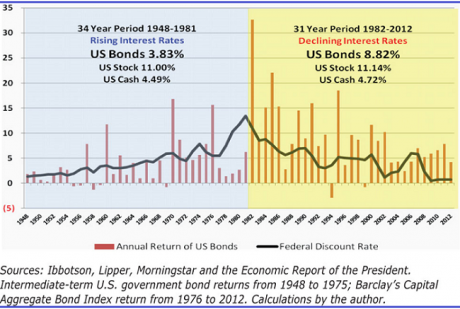
The good news is that a cyclical upswing in long-long term interest rates may not harm stocks. That’s because the average annual increase in US stocks between 1948 and 1982 (when the US Federal discount rate climbed six fold depressing bond prices) was 11%; not much different to the 11.1% increase in stock prices from 1982 to 2012 (when the discount rate slid to almost zero causing a bond price bubble).
Others argue the big jump in yields on longer-term bonds and mortgages over the last five months has been overdone, which is why they are now falling back. Also, the US Federal Reserve took money “tapering” off the table for fear it could trigger a recession given the recent fiscal standoff in Washington.
The last year that yields jumped this much was in 2009. Yields fell more than 35% in 2010 before recovering somewhat into year-end. The average in bullish years for yields (1999, 2001, 2003, 2005 and 2006) was a 28% gain. For the bearish years (2000, 2002, 2004, 2007, 2010, 2011 and 2012) yields dropped an average 16%. So maybe the worst is over, at least for this year.
Matt Blackman, host of TradeSystemGuru.com, certainly thinks so, which is why he predicts the sharemarket will continue booming, especially now that monetary dove Janet Yellen has been nominated to succeed Ben Bernanke as Federal Reserve chief.
“…2014 is a mid-term election year when the incumbent President generally initiates policies to kick the economy into high gear as he gets ready for the next election. Any tapering would be counterproductive to achieving this goal.
“As Richard Koo, chief economist for Nomura Securities, opined recently, the Fed has created its own ‘QE Trap’ by its decision not to taper and in the process established what he believes is "a vicious cycle of rising rates and economic weakness.
“In other words, they have trained market participants to punish any move to stem tapering efforts and reward a QE continuation decision. And what politician would wish to invoke the wrath of Wall Street and Main Street investors with an election approaching?”
Source: Matt Blackman, Bull/Bear Market, October 1, 2013
If the market keeps rising, then a good market timing strategy should keep you in shares. On the other hand all booms end with a correction, or worse still a bust, because markets are cyclical. When that happens it’s good to exit from the market to protect your share capital.
“Active” or “conservative” trend-trading makes money in bull markets and saves money in bear markets, and does so with less risk than a “buy and hold” approach to shares, or worse an “aggressive” trading approach based on chart patterns.
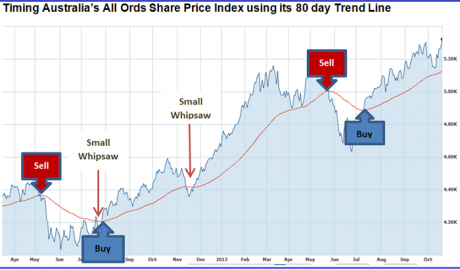
Trend-following is not full-proof because it’s subject to whipsaws when the market is choppy. But because it lets profits run and cuts losses short, over the course of a market cycle its gains during rallies and savings during corrections outweigh its modest losses from occasional setbacks.
Here’s an example of an “active” market timing model based on the 80-day exponential moving average trend-line of the All Ordinaries share price index over the last 18 months. Using this model you would have held an ASX listed equity fund (such as the SPDR S&P/ASX 200 Share Fund) when the stock index was above its red 80-day trend line and shifted to a cash management account when the index was below that red line.
There are, of course, more sophisticated models for tracking buy and sell signals. Nevertheless, the 80-day trend-trading rule provides a crude risk management tool for enjoying the sharemarket without exposing yourself to periodic large losses.
As you can see from the chart above, it allows you to sell high and buy low notwithstanding occasional small whipsaws.
Veteran American market timer, Jim Rohrbach, once said:
“There are really only two good feelings in investing. One is being in the market when it is going up, and the other is being out when the market is going down.”
I agree.
Percy Allan is a director of MarketTiming.com.au For a free three week trial of its newsletter and trend-trading strategies for listed ETF funds, see www.markettiming.com.au.

