Banking on growth
PORTFOLIO POINT: The latest results of ANZ and NAB suggest the big banks are trading below forecast valuations and will deliver good returns for investors.
The last few weeks of October and early November are always interesting because most of our major banks report their year-end results. The significance of Australian banks to our equity market cannot be understated, as their combined market capitalisation represents over 25% of the total market.
Further, the banks are a useful bellwether for the health of the economy. Credit growth normally suggests economic activity plus a positive level of business and consumer confidence.
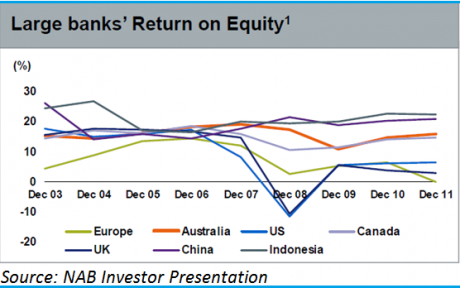
To start my overview of ANZ (in the growth portfolio) and NAB , let’s remember that all of our major commercial banks rank amongst the most profitable in the world – as measured by return on equity.
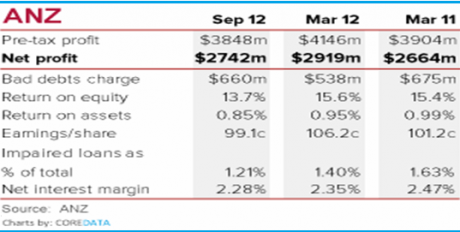
Whilst this is noteworthy, it appears from the results of both ANZ and NAB that the recent times, and indeed the last half, have been difficult. The following quick snapshot of the ANZ result confirms that earnings growth has been difficult to achieve over the last 18 months.
However, all of the commercial banks are producing underlying Australian/NZ business profit growth (pre-provisioning), but the actual reporting of the bottom line results has been affected by an “economic cycle adjustment” which is really a variation of the old-style “general provisioning”.
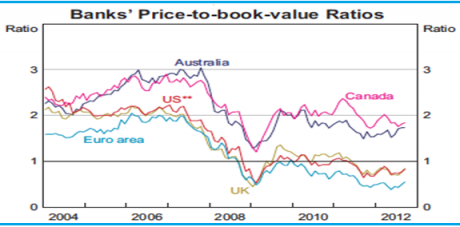
There continues to be much debate surrounding the share prices of Australian banks, with a suggestion that their market price-to-book values are too high on an international basis. These views are distorted by a misunderstanding of the power of valuing businesses based on return on equity (intrinsic value). The simplistic comparison of prices or ratios across markets without considering the underlying financial performance can lead to silly and erroneous conclusions.
The Australian banks are not over-priced and their price-to-book ratios are not excessive. My intrinsic valuation adjusts for the value of franking credits in determining the returns to an Australian investor, and my view is that banks are between 5% to 10% below their forecast valuations for mid 2013.
ANZ a superior result to NAB
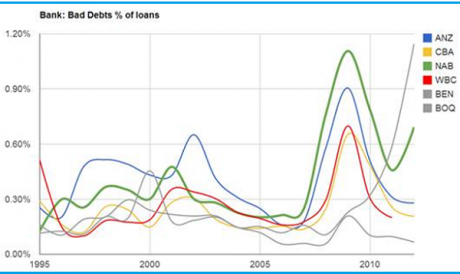
The ANZ result is consistent with other banks that are exhibiting a decline in returns on equity over the last year. Each of ANZ, NAB and WBC has suffered a profitability decline, with ROE dropping below 15% (not normalised for franking), and this has been caused by a combination of increasing capital adequacy requirements (Basel III compliance), slowing asset growth and declining interest margins. Bad debt provisioning has actually been held steady (except for NAB’s UK operations) as the banks had previously moved quickly to tighten their lending criteria to small business.
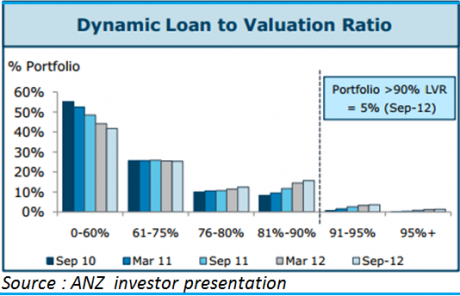
The residential loan books continue to exhibit low defaults, but it appears both NAB and ANZ have recently been aggressively growing market share. The consequences of this strategy need to be monitored carefully and the uptick in highly-leveraged mortgage lending by ANZ suggests an aggressive approach to lending.
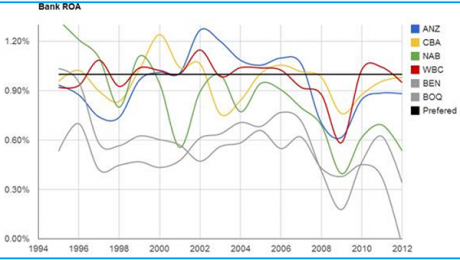
Reviewing return on assets, I note that ANZ continued to achieve good results. A declining net interest margin was offset by a reduction in bad debt provisioning. This was in stark contrast to NAB, which suffered increasing bad debts in the UK.
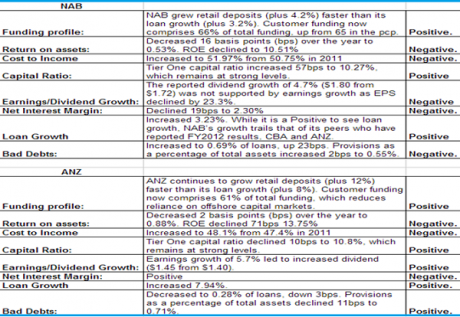
The following is a direct comparison of the key operating metrics for ANZ and NAB in their 2012 final reports.
In summary, the recent half performance of the ANZ was of a superior quality to that of NAB and therefore justifies its preferred position in the growth portfolio. However, for those who own NAB it is worth remembering that the Australian operations appear to be as robust and profitable as those of ANZ. It is the overhang of the poorly performing UK operations that dilute the overall returns of the NAB Group.
Both banks improved their funding profile by lifting Australian retail deposits. This reduced the offshore wholesale funding liabilities of each, but it has not resulted in a lower cost of funds. The Australian deposit market remains competitive and more so as funds flow into high-yielding listed securities.
Finally, and noteworthy, is the capital strength of both banks. The capital ratios suggest compliance with Basel III, and so both banks have been able to increase dividends despite moderate earnings growth. Indeed, given the maintenance of a benign bad debt occurrence, I suspect that dividends will grow again by between 3% and 5% in 2013. It is the dividend yield and potential growth that suggests that an owner of bank shares can achieve at least a 10% return over the coming year.
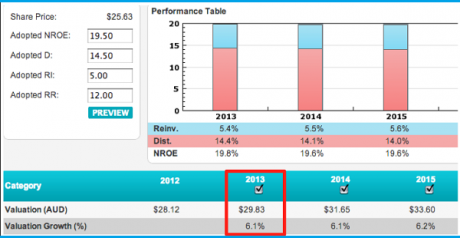
Figure 9. Future Value Estimates: ANZ Banking Group
John Abernethy is the chief investment officer at Clime Investment Management.
If you’re a sophisticated investor, wholesale investor or have $500,000 or more to invest, Clime is offering you the opportunity to discuss your portfolio and investment options with John Abernethy. Click here to register your details.
Clime Growth Portfolio
Return since June 30, 2012: 13.83%
Returns since Inception (April 19, 2012): 5.40%
Average Yield: 6.87%
Start Value: $111,580.24
Current value: $127,010.90
Clime Growth Portfolio - Prices as at close on 1st November 2012 | |||||||
| Company | Code | Purchase Price | Market Price | FY13 (f) GU Yield | FY13 Value | Safety Margin | Total Return |
| BHP Billiton | BHP | $31.45 | $33.82 | 5.07% | $43.14 | 27.56% | 8.87% |
| Commonwealth Bank | CBA | $53.10 | $57.27 | 8.68% | $61.42 | 7.25% | 13.75% |
| Westpac | WBC | $21.13 | $25.14 | 9.77% | $27.31 | 8.63% | 23.53% |
| Blackmores | BKL | $26.25 | $29.65 | 6.41% | $29.85 | 0.67% | 16.65% |
| Woolworths | WOW | $26.80 | $29.01 | 6.60% | $31.22 | 7.62% | 12.25% |
| Iress | IRE | $6.55 | $7.53 | 6.05% | $7.65 | 1.59% | 17.05% |
| The Reject Shop | TRS | $9.15 | $14.04 | 4.27% | $15.38 | 9.54% | 41.74% |
| Brickworks | BKW | $10.10 | $10.86 | 5.39% | $12.27 | 12.98% | 10.96% |
| McMillan Shakespeare | MMS | $11.82 | $12.99 | 5.72% | $13.66 | 5.16% | 13.87% |
| Mineral Resources | MIN | $8.95 | $8.30 | 9.12% | $12.41 | 49.52% | -1.88% |
| Rio Tinto | RIO | $56.50 | $56.25 | 4.34% | $66.74 | 18.65% | 1.09% |
| Oroton Group | ORL | $7.30 | $6.59 | 11.06% | $6.16 | -6.53% | -3.59% |


