Australia's emissions growth error
There has been a widespread belief amongst government policymakers that the 2020 target to reduce emissions 5 per cent below the levels that prevailed in 2000 would be incredibly challenging.
Underpinning this belief is the assumption that Australia will experience robust growth of industry and population that would inevitably drive significant growth in energy demand and greenhouse gas emissions. Yet they are now being blindsided by factors they failed to foresee just a few years into the future.
A good example of this world view came from former Prime Minister Kevin Rudd’s economic adviser Andrew Charlton in the November 2011 Quarterly Essay:
“The point that critics of Australia’s target miss is that rapid population and economic growth are working against us. This means that relative to 2000 levels, a 5 per cent reduction in 2020 is a big ask for our economy. As of 2010, Australia’s emissions were already about 5 per cent higher than in 2000. Population growth and economic growth make our target harder to achieve by 16 per cent and 15 per cent respectively between now and 2020. To overcome these headwinds….Australia will need a massive shift to clean energy if we are to reduce our energy emissions, equivalent to a 31 per cent reduction in Australia’s emissions. This is an enormous challenge.”
If we look at the latest government emissions projections released last October, they foresaw that even with a carbon price in place, Australia’s domestic emissions were expected to rise by 67.6 million tonnes of CO2 from the start of the projection in 2011-12 to 2019-20. Critically, about 30 per cent of this rise was expected to occur in just the single year of 2011-12.
Well guess what?
It was an incredibly big overestimate.
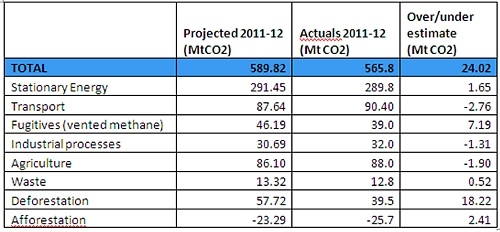
Just a few days ago the government released its 2012 December quarter official emission accounts showing up-to-date actual emissions over the 2011-12 period. The table below details for each major sector what the government projected would be emitted in 2011-12, and what the official emissions accounts estimate actually occurred.
Rather than experiencing the second highest year of emissions growth since detailed records were collected, we in fact had a decline in emissions of 4 million tonnes of CO2. And the economy still grew by 3.4 per cent at the same time.
Australia’s emissions in 2011-12 – Projections vs Actuals
(positive numbers indicate an overestimate of emissions in the projections)

Sources: Department of Climate Change and Energy Efficiency (2012)Australia’s Emission Projections 2012; Department of Climate Change and Energy Efficiency (2012) Quarterly Update of Australia’s National Greenhouse Gas Inventory: December 2012
Contrary to Andrew Charlton’s lament, emissions in 2011-12 were back at the same level they were in 2000. What’s more, this lower level of emissions means the government now has an even bigger bank of surplus Kyoto allowances (likely to be more than 100Mt CO2), which it can use to offset against its 2020 target.
Yet we still need to be cautious before cracking open the champagne.
One of the key sources of the overestimate – deforestation – is notorious for its uncertainty and revisions. These numbers are based on satellite imagery that is not updated regularly, so the emission account numbers are still preliminary. It’s conceivable that it could be revised upwards after up-to-date satellite images are analysed.
Also the major flooding of Queensland coal mines in 2011 impeded planned increases in coal mine production over 2011-12 to 4.8 per cent, but over 2012-13 black coal production is expected to expand by 10.5 per cent.
Still there are good reasons to believe that emissions may grow slower than what Andrew Charlton or the government imagined.
If we look at emissions from the September and December quarters of 2012-13, electricity emissions are down about 7 per cent relative to the same quarters in 2011-12. The projections expected just a 0.5 per cent decline in 2012-13.
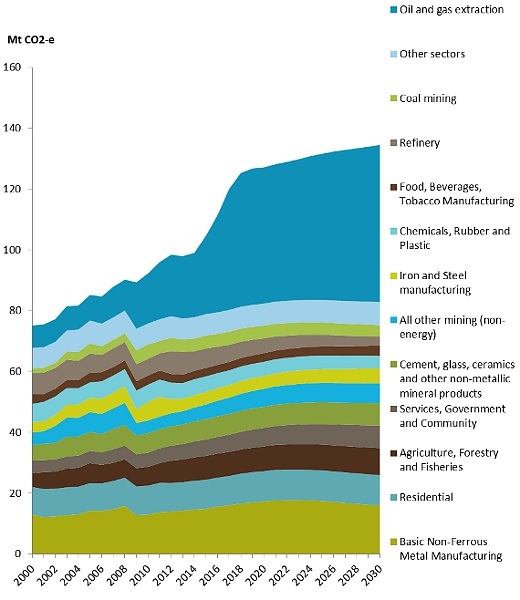
Also the hollowing out of manufacturing that is being spurred by the high Australian dollar may also produce some surprises in direct combustion and industrial gas emissions. The government’s projection for emissions from direct combustion, charted below, illustrates in blue the rapid growth in oil and gas extraction emissions, due primarily to new LNG facilities.
These are pretty much locked-in, but we might be surprised by declines in emissions for the other sectors shown in the chart. Cement production, steel, non-ferrous metals, and oil refining are all struggling due to the high dollar. In addition chemical production is likely to be squeezed by rapid inflation in the gas price.
Sectoral breakdown of emissions from stationary energy direct combustion

Source: Department of Climate Change and Energy Efficiency (2012) Australia’s Emission Projections 2012
Declines in production from these sectors would also lead to direct reductions in the 32 million tonnes of CO2 emissions categorised under industrial processes.
One last potential surprise lies in fugitive methane emissions from coal mining. A significant proportion of coal mining fugitive emissions are from open cut operations where emissions have traditionally been inferred by rough default estimates, rather than direct measurement of a coal seam’s methane content.
A source heavily involved in emissions measurement and verification informed me that a number of major coal miners are now moving towards direct measurement methods. This is because they have worked out their actual emissions are likely to be substantially lower than the default inferred estimates and this will lower their carbon permit liability.
Continuing declines in emissions, like what occurred for 2011-12, can’t be taken for granted. But the following factors beyond the carbon price may be making the 2020 emissions target far easier than thought:
-- The high Australian dollar;
-- Rapidly rising gas prices due to LNG;
-- More frugal and energy efficient electricity consumers spurred by spikes in network charges as well as government policy; and
-- Drops in solar PV prices.


