AEMO downgrades electricity demand, again
The Australian Energy Market Operator has released updated forecasts of electricity demand, downgrading both annual and peak demand across the NEM. This comes on top of slashing demand forecasts in the prior year.
This big shock to the electricity market is illustrated below in our charts of the week.
Total annual electricity consumption
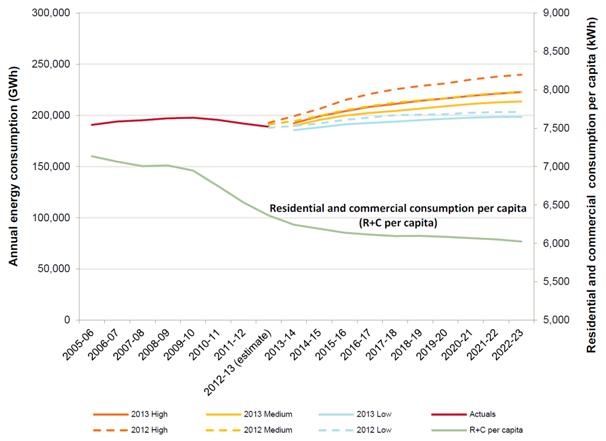
The chart below illustrates how AEMO has reduced its expectations of annual electricity consumption, with the dashed coloured lines representing last year’s forecast and the solid orange, yellow and blue lines its latest forecasts. AEMO has also provided further detail on how residential and commercial sector consumption on a per capita basis has declined since 2005-06, and what it foresees out to 2022-23.

Source: AEMO (2013)
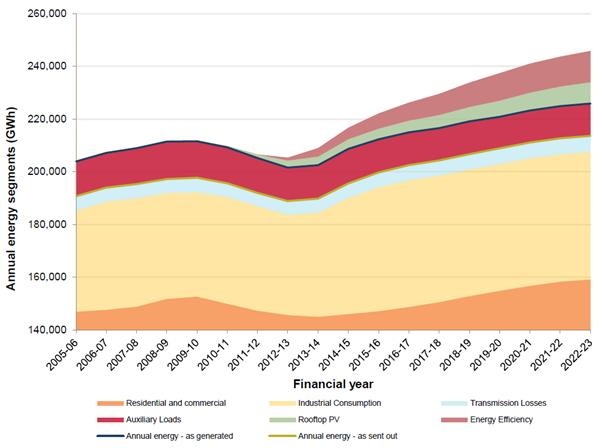
AEMO then zooms-in to provide a further breakdown on how consumption is distributed in the chart below. One can see a noticeable decline in consumption starting in 2009 during the perfect storm of the Global Financial Crisis, coinciding with skyrocketing network charges, the plunge in the cost of solar PV, the high Australian dollar and energy efficiency policy hitting its straps.
Contrary to the assertions of some that this is solely about industrial restructuring, the chart illustrates the decline of residential and commercial consumption played a very big role in the overall decline in electricity consumption.
Breakdown on annual electricity consumption by demand source

Source: AEMO 2013
Looking forward, AEMO has estimated the future impact of energy efficiency and rooftop PV. This wipes out nearly 20,000GWh by the end of the outlook period – almost equivalent to taking SA and Tasmanian demand out of the NEM.
No wonder the Energy Supply Association is starting to complain about solar PV and energy efficiency initiatives.
AEMO observes:
Continued increases in rooftop photovoltaic (PV) systems and energy efficiency savings from new building regulations have offset growth in residential, commercial and light industrial annual energy.
Lower-than-expected growth in most industrial sectors reflects the closure of the Kurri Kurri aluminium smelter in New South Wales, changes in operating levels of Victoria’s Wonthaggi desalination plant, and the Olympic Dam mine expansion deferral in South Australia. A high Australian dollar in recent years also contributed to the dampening in annual energy growth.
Peak demand
In terms of peak demand, AEMO has slashed NEM-wide peak demand by 728MW for 2013-14, the equivalent of shutting Kogan Creek – the most recently built coal-fired power station in the NEM.
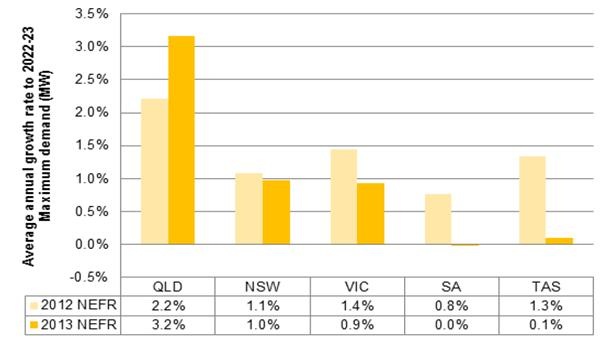
Looking further forward, AEMO has retained its bearish expectations for peak demand growth from last year’s forecast, illustrated below. The one bright spot for power generators is significant increases in peak demand expectations for Queensland based on LNG plant developments. In terms of SA and Tasmania, peak demand growth has been cut to virtually zero.

Source: AEMO (2013)
These results will only darken the mood of the incumbent electricity generators, worried about a future influx of wind power. Yet this influx has repeatedly failed to come to pass, now being delayed by energy retailers going on strike on power purchase agreements until they know what the Coalition plans on doing to the Renewable Energy Target.
But the results are unambiguously good news for carbon emissions. They also show that demand-side carbon abatement initiatives, regularly mocked as token efforts that would never amount to anything, are a formidable force once they get going.


