A cost-of-living crisis? Tell 'em they're dreaming
We are frequently told that Australian cities are among the most expensive in the world. But is it really a cost-of-living crisis or a cost-of-living delusion? Research by the Reserve Bank of Australia provides some insight into the issue.
A brief piece in the RBA quarterly bulletin, Inflation and the Cost of Living, analyses the extent to which different households face cost-of-living pressures.
Australian households frequently rate cost-of-living pressures among their greatest economic concerns. Both the Coalition and the Labor Party have tried to position themselves as the party that is most concerned about the so-called cost-of-living crisis.
We’ve had ‘fuel watch’ and ‘grocery watch’ -- both silly ideas that are now defunct -- and the Coalition went to the election firmly on the grounds that it would axe the carbon and mining taxes and provide cost-of-living relief for Australian households.
The RBA's article indicates that for the average household there is no cost-of-living crisis, though there may in fact be a number of cost-of-living delusions. But while it is easy to discount the cost-of-living crisis as media sensationalism combined with political opportunism, the reality is that the experience of inflation can vary significantly for different households across time.
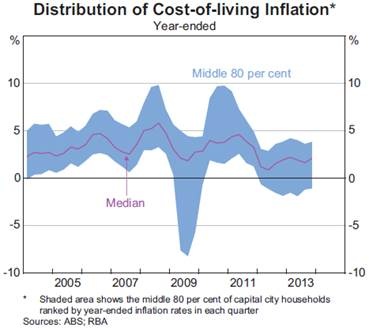
The graph below shows the distribution of cost-of-living inflation across households. Eighty per cent of households sit within the blue shaded area. Generally speaking, most households experience fairly similar cost-of-living changes, though there are certainly episodes where prices fluctuate to a greater degree.
At various points, there are going to be households that struggle to maintain their standard of living, but the data suggests that in the absence of job losses those periods are generally short-lived.

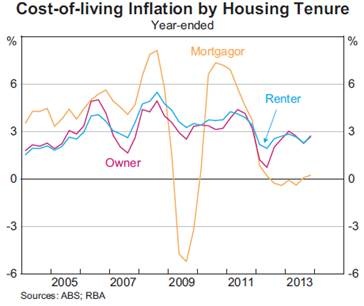
The major driver of the short-term variation in inflation across households is due to changes in interest rates. This factor largely explains the 2009 and 2010 episodes in the graph above. But the influence of interest rates on cost-of-living is easier to digest in the following graph, which shows cost-of-living changes by household type. It is a sobering thought for those genuinely struggling with cost-of-living pressures now -- it is unlikely that mortgage rates can go much lower.

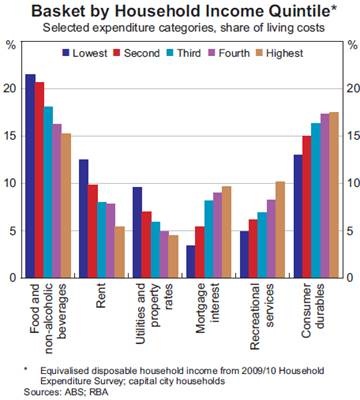
Over the past decade, low income households have experienced slightly higher rates of inflation than high income households. This is compounded by the fact that low income households have also experienced lower income growth, though this is more than offset by real income growth.
Lower income households generally spend a larger proportion of their income on life’s necessities, such as food and housing. Consequently, they have been exposed to larger price rises than higher income households.

The data itself sits in stark contrast to the importance that cost-of-living issues have in elections and the media’s coverage of the issue. How can this be reconciled?
The answer is likely to depend on our psychological processes. More specifically, research suggests that many households have a somewhat warped view of changes in their cost-of-living.
First, individuals or households are more likely to focus on products where prices have increased, rather than those which have fallen. Second, we tend to take greater note of large price changes that happen infrequently, such as changes to gas or electricity bills, than to prices that change smoothly. Third, we also pay more attention to price changes for goods that we purchase frequently, such as gas and food, which often have volatile prices.
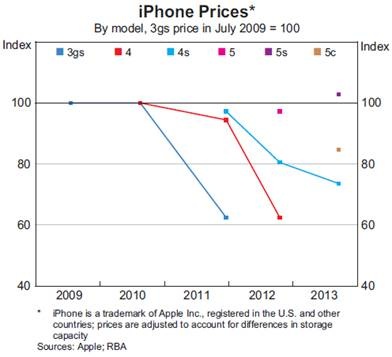
An additional factor is that we may not fully incorporate the effect of improving quality when judging our cost of living. The RBA has an interesting graph on iPhone prices that shows that although the price of each new model has been similar, the actual product has improved significantly. Everyone would recognise that the 5S is better than the 3GS, but we may not intuitively make that same link when considering our cost-of-living and living standards.

A final reason for the difference between actual and perceived cost-of-living pressures is that some households may be falling into the trap of trying -- and failing -- to ‘keep up with the Joneses’. It may not be that they are struggling to maintain their current living standards so much as it is that they are struggling to keep up with the living standards of others.
Research by the RBA indicates that cost-of-living pressures are not particularly widespread. However, for a small share of households -- probably at the lower end of the income distribution -- it may be an ongoing problem. Other households may suffer issues during periods of rising mortgage rates. For most people though, the cost-of-living crisis is most likely a cost-of-living delusion brought on by our psychological approach to assessing price changes.


