Crunching SMSF returns for FY18


Summary: A positive year for all asset classes, and investors of all risk profiles. How did you perform as an SMSF investment manager?
Key take-out: Index fund managers generally lifted their returns last financial year, with Australian shares outperforming.
Nothing blew anything out of the park, but it was a solid year across investment markets. You should have every reason to smile.
Unlike last year, when fixed interest dipped into a rare negative, all asset classes were in positive territory. Nobody's overall return should have been in the red – unless your fund had ridiculous amounts of Telstra and AMP.
However, the returns from defensive asset classes continued to be anaemic.
As the investment managers of your self-managed super fund, you are actually accountable to no one but yourself. You don't have to compare yourself to anyone. You're not going to lose a mandate to manage funds if you underperform.
But you should be benchmarking yourself. And that is the aim of this annual column.
How did you go?
The number that you should have aimed to beat this year is 8.25 per cent. That's the return that you could have got, after fees, from taking the management headaches away from yourself and simply investing via index managers.
Last year, the figure was 7.93 per cent, so, arguably, your performance as a manager should have marginally better this year than last.
And for those wanting the three-year figure, you should have returned 6.88 per cent compound over the last three years, up from 6.66 per cent in the three years to June 30, 2017.
This annual column is now in its ninth year. You will find previous years returns and columns in the Eureka Report archives. (Here are the last five years: 2017, 2016, 2015, 2014 and 2013.)
The sort of return your portfolio achieved last financial year will, of course, be dependent on the assets your SMSF holds.
The truly defensive – those with the majority of their funds in cash and fixed interest investments – had returns that were less than impressive, but still stronger than last year. As we know, interest rates have been on the bottom deck for years and this has impacted both asset classes.
Holding growth assets – as in, shares and property – was necessary to be able to break through double digits in the returns department.
So, how did each of the asset classes perform in FY2018?
The returns of the individual Vanguard sector funds (after fees) were:
- Cash Reserve Fund: 1.79 per cent
- Australian Fixed Interest: 2.87 per cent
- International Fixed Interest (hedged): 2.19 per cent
- Australian Property Securities: 13.01 per cent
- International Property Securities (hedged): 5.63 per cent (unhedged at 9.19 per cent)
- Australian Shares: 13.09 per cent
- International Shares (hedged): 11.49 per cent (unhedged at 15.44 per cent)
For consistency, the overall returns in the tables below continue to use the hedged versions of the international products.
Risk profiles and returns
In most of these annual columns, I've had to warn that not being invested in international assets has been to your detriment. By and large, international shares have clocked up higher returns over the years than domestic equities.
Nevertheless, Australian shares and property topped the list this year. Not by outstanding amounts. But Australian shares performed around 1.6 per cent better than their offshore peers, and Australian property was around 7.5 per cent better than international property.
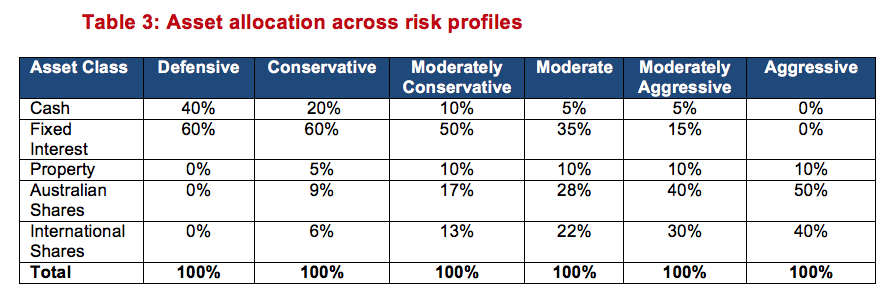
It's the act of diversifying these assets that helps to reduce risk and smooth out returns. To what extent you should be diversifying, and into which asset classes, will depend on your risk profile.
Obviously, the more defensive, the more that is in cash and fixed interest. The more aggressive, the more that is in property and shares.
The following tables show the sort of return you could have expected, from defensive through to aggressive.
‘Defensive' investors are completely invested in cash and bonds (0-100), while ‘aggressive' investors are 100 per cent in property and shares, with nothing in defensives (100-0). The ‘moderate' investor is 60 per cent in property and shares, and 40 per cent in cash and fixed interest (60-40).
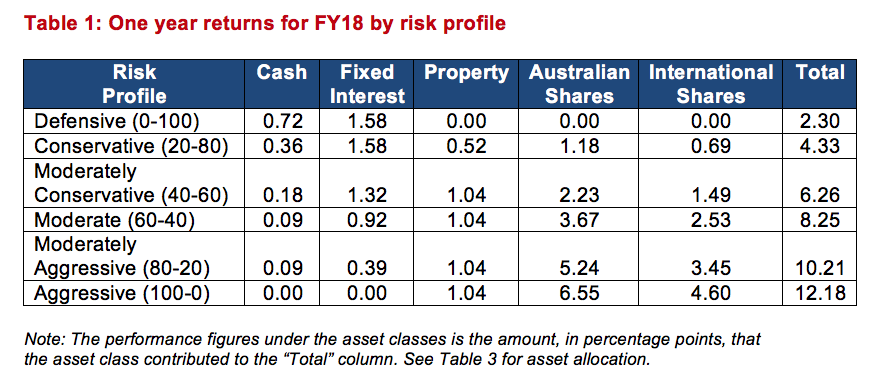
As above, the moderate investor should have managed to improve on last year's return marginally, with a total return of 8.25 per cent. More aggressive investors eked out nearly an extra 2 percentage points per risk profile, while the most aggressive investors should be aiming this year to achieve 12.18 per cent.
Year-on-year, the return for the risk-averse actually showed a big improvement. Defensive investors got 0.48 per cent in FY17, but this return lifted to 2.3 per cent this year. Meanwhile, conservative investors saw their returns improve from 2.4 per cent to 4.33 per cent from year to year.
Stretching out the analysis
SMSF investors, to a degree, should be focused on slightly longer return periods. And certainly many are.
So, how should you have performed over the three-year period to June 30, 2018?
The returns for the combined FY16, FY17 and FY18 period are quite ‘normal' as per classic investment theory and the profile of risk versus return. That is, as you progressively take on more risk, you are progressively more rewarded.
The returns of the individual sector funds for Vanguard (after fees) for three years were:
- Cash Reserve Fund: 2.1 per cent
- Australian Fixed Interest: 3.21 per cent
- International Fixed Interest (hedged): 3.67 per cent
- Australian Property Securities: 9.91 per cent
- International Property Securities (hedged): 7.62 per cent
- Australian Shares: 8.96 per cent
- International Shares (hedged): 9.89 per cent
Australian property is, just, sitting atop on performance, edging out international shares by just 2 basis points.
What I find interesting is that institutions and commentators have been warning for many years to expect lower returns into the future. The three-year figures – and that commentary must have been running for three years by now – shows that returns are still, roughly, where they are expected to be.
A moderate return is around 7 per cent and an aggressive return around 9 per cent.
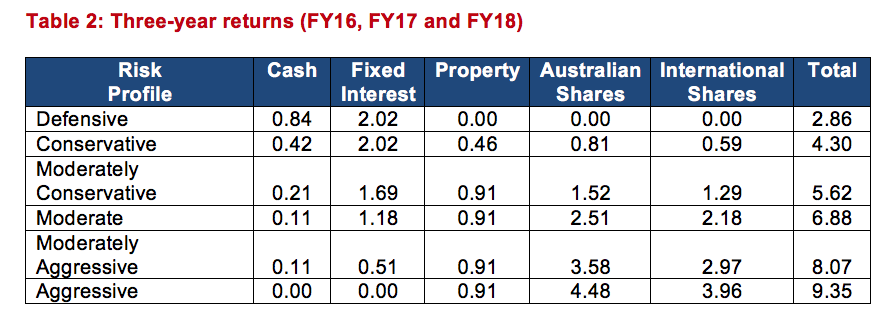
With inflation over the last three years averaging around 1.7 per cent, the returns are overall pretty strong, with perhaps the exception of the returns experienced by defensive investors.
Moderate investors are getting a return of more than inflation plus 5.1 per cent, while the most aggressive investors are getting inflation plus 7.65 per cent. If maintained over even longer terms, these are certainly strong returns.
For those wanting to know what asset allocations were used to achieve the blended risk profile performance figures, see Table 3. For fixed interest, property and international shares, a split of 65 per cent domestic to 35 per cent international was used.
Notes on this annual exercise
The point of this annual column is to show SMSF trustees what sort of returns they could have achieved if they left everything to index fund managers, who charge tiny fees to try to get a return within a small margin for error from the major indices.
I realise that's not why most trustees take on the role, or start their own SMSF, but this column is also designed to be a reminder of how you can take on the investment risks about which you believe you might have some expertise (such as, perhaps, Australian shares, cash and maybe even fixed interest), while outsourcing investment management for other asset classes, such as international shares and property, or even domestic REITs to low-cost index fund managers.
Mainly, it is designed to give you a benchmark for you to compare your SMSF's performance.
The information contained in this column should be treated as general advice only. It has not taken anyone's specific circumstances into account. If you are considering a strategy such as those mentioned here, you are strongly advised to consult your adviser/s, as some of the strategies used in these columns are extremely complex and require high-level technical compliance.


