Should we sell in May and go away


Summary: While the May – September period typically sees share markets lose ground before advancing in October, this seasonal pattern does not always hold. The 50 by 250 trend line for the All Ords is actually inching closer to a buy signal, while price momentum looks strong. This could indicate the market is bucking the May trend. |
Key take out: The market correction between April 2015 and February 2016 was close to the average period of a crash – this could suggest the worst is over, but we will have to wait and see if the market pulls back or keeps its current momentum. |
Key beneficiaries: SMSF trustees and superannuation accountholders. Category: Shares. |
May marks the beginning of the traditional down season in shares, which typically lasts until September. The following chart shows how over the twenty years to 2015 America's S&P 500 index lost ground between May and September and then advanced strongly from October to April.
Sell in May and go away?
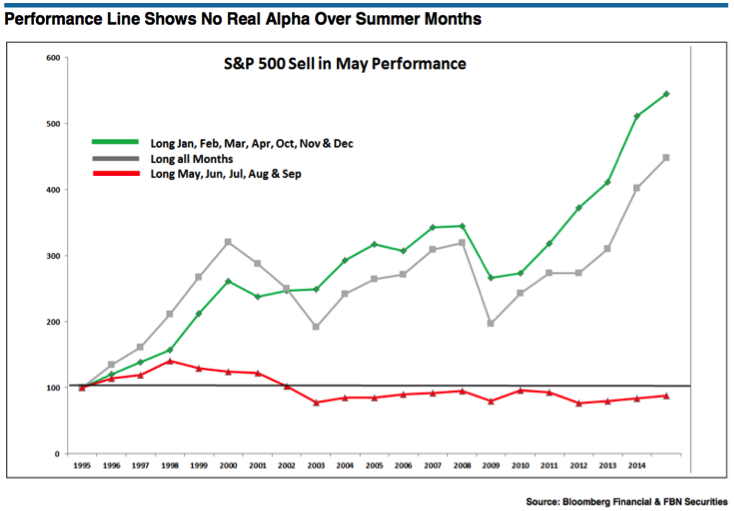
Source: Business Insider
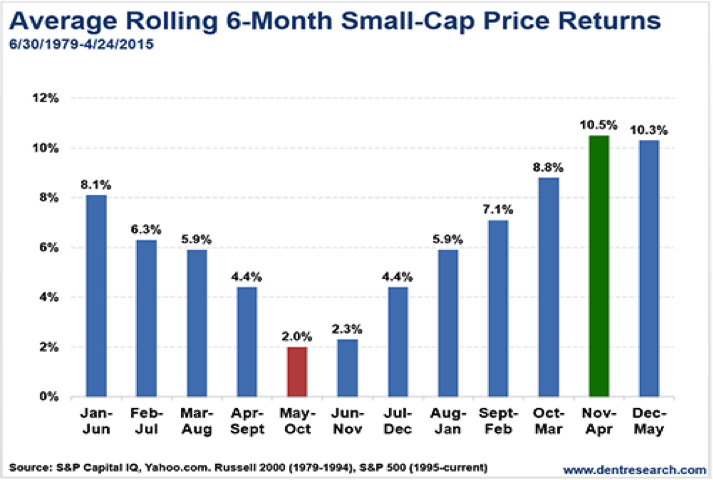
Here's the pattern for American small cap stocks since 1979. Note that the lowest returns were recorded between May and October and the highest between November and April.
In Australia the story is similar, though our slowdown usually starts in April with a bounce back in July before sliding through to November and then taking off again.
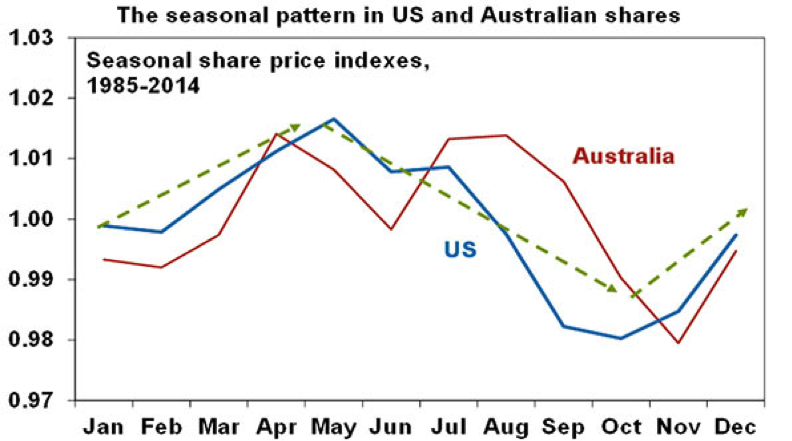
Source: AMP Capital
So recognise that late autumn and winter could be lacklustre or negative for the share market from an actuarial viewpoint. Yet don't expect share markets to always follow the average seasonal pattern depicted above.
For instance my favourite market timing signal – the crossover of the 50 by 250 day trend lines for the All Ords index - is inching closer to a Buy signal each day. Also the Coppock indicator has flattened though not turned up yet. See my column last month (read here: Managing the global market slowdown) for a fuller explanation of how to use this strategy to mitigate market risk.
A simple market timing strategy
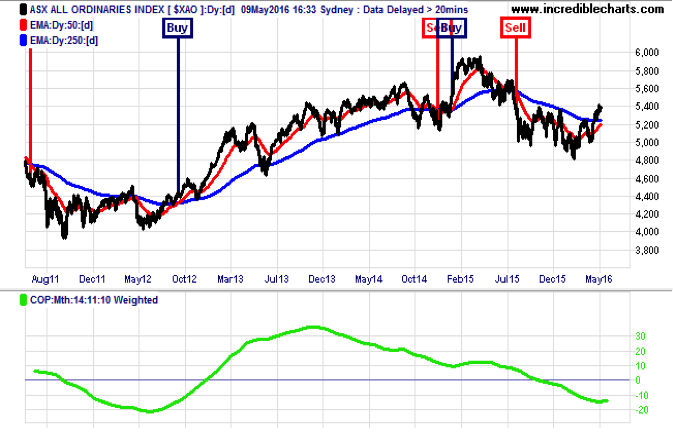
Should both these indicators become positive they would show the market is bucking its normal seasonal pattern unless it was a false recovery. But at no time in the history of the All Ords index has both a golden cross on these trend lines and an upward moving Coppock index in negative territory got it wrong.
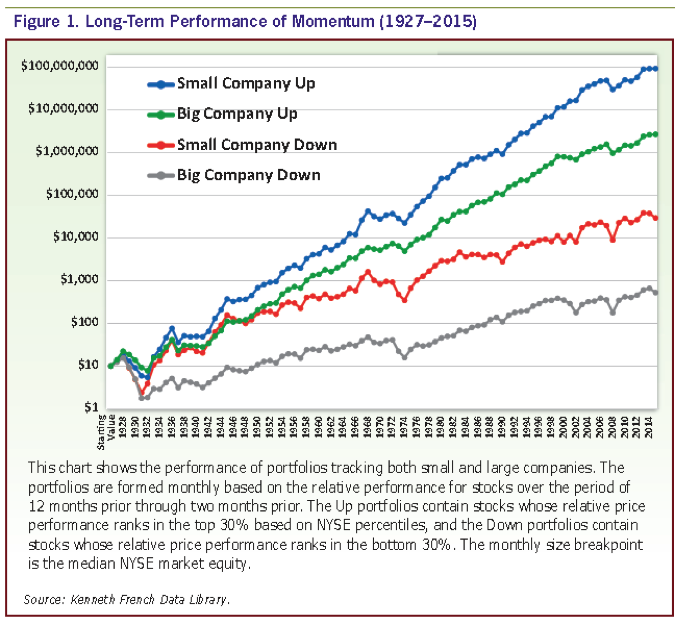
For further comfort one can also check how the All Ords index's momentum looks over a six to 12 months' time range.
There is considerable evidence that the rate of change in the stock market's price momentum over this time range is a powerful predictive tool. Gary Antonacci (Dual Momentum Investing – An Innovative Strategy for Higher Returns with Lower Risk, 2015) and Mebane Faber (Global Asset Allocation: A Survey of the World's Top Investment Strategies, 2015) found momentum investing not only works, but gave the best risk adjusted returns of any approach.
The feature article in this month's issue of the AAII journal (to read, click here) includes this chart from the data base of Professor Kenneth French, one of the most distinguished scholars of asset pricing. It confirms that shares with strong price momentum far outperform those with weak momentum.
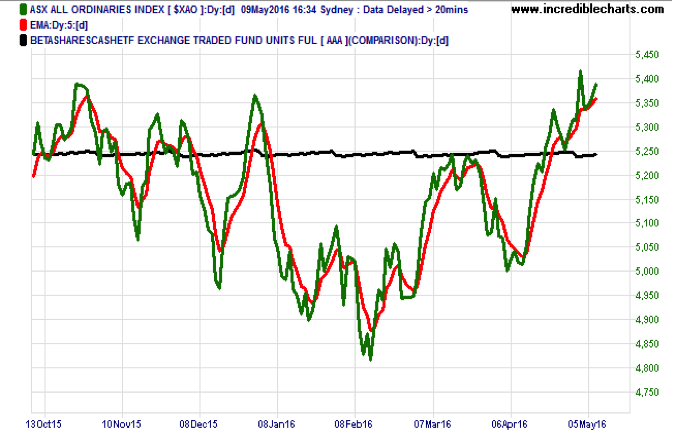
Over a six, seven and eight month period the All Ords index displays positive momentum. See the chart for seven months below, where the index has moved above the black line which represents the unit price of a cash fund (the ETF with the ASX code AAA). The index includes a red weekly trend-line for smoothing its daily fluctuations.
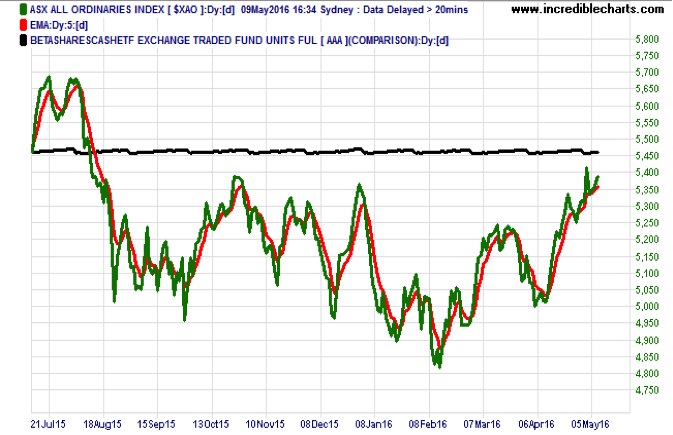
But over a nine, 10, 11 and 12 month's timeframe the index's momentum is still negative.
The ten months momentum chart is illustrative of this below. Note that it is has been trending north in negative territory since February and is now within striking distance of moving into positive territory above the black line representing the cash fund.
The 19.1 per cent correction in the All Ords index between April 27 2015 and February 12 2016 was just shy of the 20 per cent fall that qualifies as a crash. But its 9.5 months duration was close to the average duration of a crash of 10.3 months. See chart below. This too suggests the worst might be over, though note that market crashes have lasted between two and 22 months since 1960.
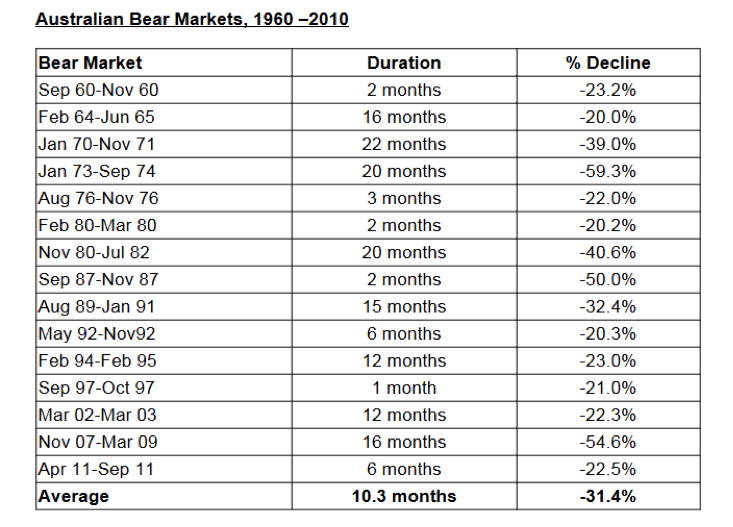
Source: Market Timing
So we shall now wait and see if both trend and momentum indicators trigger a Buy signal for the Australian share market or whether they pull back again confirming the existing Sell signal.
Percy Allan is Editor of MarketTiming.com.au. For a free three week trial of its newsletter and trend-trading strategies for listed ETF funds see www.markettiming.com.au.


