ASX: Result 2017
Recommendation

ASX has turned out one of the duller results of the current reporting season, with 2% increases in revenue and net profit. But it was nonetheless an impressive performance, given that equity capital raised fell 29% and the value of trading on the ASX rose only 2%.
Key Points
-
Revenue and profit up 2%
-
In spite of a 29% fall in capital raised
-
DLT on track for December decision
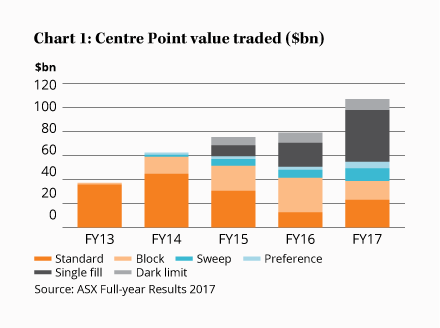
Against that backdrop, it's somewhat surprising that cash market trading saw the strongest growth among ASX's business units, with a revenue increase of 13% to $46m. The move reflects the continued shift of trading onto ASX's own ‘dark pool', Centre Point, which saw its value traded rise 36%. That took it to 8.6% of value traded in 2017, up from 6.6%.
Even within Centre Point, there's a shift towards more specialist trade types (see Chart 1). Because of the flexibility it offers, Centre Point enjoys higher margins than the main market, and that shows up in the increase in ASX's average trading fee from 0.33 bps (basis points, or one hundredth of a per cent) to 0.37 bps of traded value.
Technical services revenue increased 8%, to $67m, thanks to an increase in service connections and a 23% increase in the number of customer cabinets at the ASX's Australian Liquidity Centre. Information services rose 3% to $83m, supported by ASX's appointment as the administrator for the BBSW interest rate benchmark.
These three areas, which come together as ‘Trading Services', saw their revenue increase a healthy 7% to $196m.
The laggard was Listings and Issuer services, which saw flat revenues of $193m. But that was a decent performance given the 29% fall in capital raised. The number of IPOs, however, actually increased (from 124 to 152), and this supported revenues since smaller IPOs pay a higher level of fees per dollar raised.
OTC soars
Derivatives and OTC Markets – the largest division – saw a 1% revenue increase, to $269m, driven by a 4% increase in futures volumes, offset by a 2% fall in the average fee per contract. There was another excellent contribution from OTC clearing, where the notional value cleared reached $5.2 trillion, from a standing start in 2013 and almost double the level of 2016.
The final and smallest division, Equity Post-Trade Services – which does the clearing and settlement for sharemarket trades – increased revenue by 2% to $104m, with a 7% rise in Settlement revenues (to $51m) offset by a 2% fall in Clearing revenues (to $53m). Both areas benefitted from the increased number of trades being conducted on ASX Centre Point, as opposed to off-market, but the Clearing performance was particularly notable because it came despite a 10% fee reduction.
| Year to Jun ($m) | 2017 | 2016 | /(–) (–) |
|---|---|---|---|
| Listings and Issuer Serv. rev. | 193 | 193 | 0 |
| Derivs and OTC Mkts rev. | 269 | 266 | 1 |
| Trading Services | 196 | 183 | 7 |
| Equity Post-Trade Serv. Rev. | 104 | 102 | 2 |
| Total op. rev. | 764 | 746 | 2 |
| Op. expenses | 227 | 213 | 6 |
| Op. profit | 537 | 533 | 1 |
| Net profit | 434 | 426 | 2 |
| EPS (c) | 225 | 220 | 2 |
| DPS (c) | 202 | 198 | 2 |
| *Final div. of 99.8c, fully franked, up 2%, ex date 7 Sep | |||
Operating expenses rose 6% – in line with guidance – mostly due to a 4% increase in staff numbers, mainly in business development and technology.
That meant a 2% rise in net profit to $434m and the same increase in earnings per share, to 224.5 cents. Capital expenditure came to $50m, in line with guidance, and that left free cash flow of $421m, or 97% of net profit. The final dividend has been increased by 1% to 99.8 cents, making $2.018 for the full year, 2% ahead of 2016 and in line with the targeted 90% payout ratio.
DLT on track
Management said it is having a third party review its proposed distributed ledger technology (DLT) replacement for the CHESS system, particularly as regards its security features, and it remains on track to make a decision on the new system in December. If it's approved, details of the system will be published in March 2018 for a further round of consultation.
Low single digit growth is again expected for 2018, which would put the stock on a forward price-earnings ratio of about 24 and fully franked dividend yield of 3.8%. That's not quite cheap enough for a Buy but it's plenty to encourage existing shareholders to HOLD.
Note: The Intelligent Investor Growth Portfolio and Equity Income Portfolio own shares in ASX. You can find out about investing directly in Intelligent Investor and InvestSMART portfolios by clicking here.
Recommendation


