Why five-to-seven years isn't adding up


Summary: Investors in Australian shares are on the cusp of a 10-year period of poor returns, with cash actually outperforming domestic equities since mid-2007. |
Key take-out: The ‘five-to-seven-year' rule for expecting a positive experience for investing in shares is being challenged, although post-GFC investors who used 2009 as a buying opportunity have been rewarded. |
Key beneficiaries: General investors. Category: Shares. |
As I started out as an investor, I remember thinking that managed funds would clearly be the best investment vehicle for me. They have the benefits of a professional manager and the administration is done for you. Also, while I didn't fully understand them, I felt fees didn't seem like too big a deal because I was confident my fund manager would outperform the average market.
I understand, now, that the reality of investing in managed funds is quite different. As I looked around the glossy fund manager brochure starting out as an investor, I noticed that the most common time frame suggested for a successful investment in a share-based managed fund was five to seven years.
One thing that the investment period from end-2007 to now has shown us is that the ‘five-to-seven' year wisdom is not good enough for all periods. The Australian share market hit a peak in late 2007 closer to 7000 points than 6000 (the All Ords was 6779 in October of 2007).
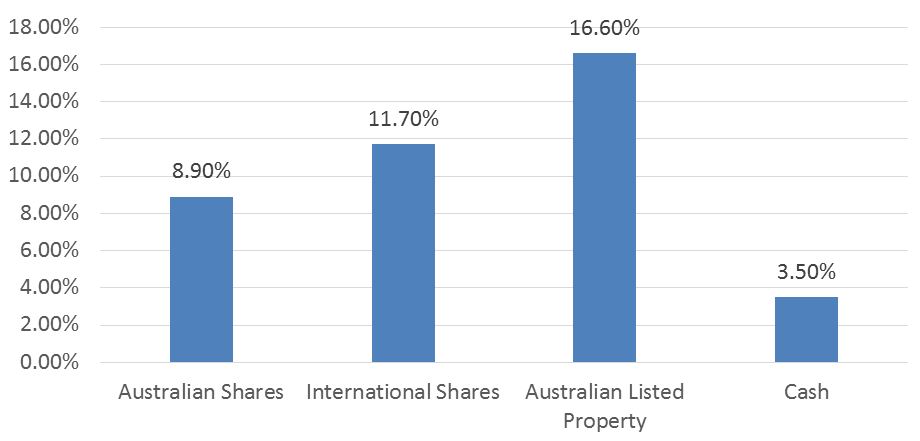
The following graph, based on average share market returns, provides some initial data for us to look at as investors over a nine-year period from July 1, 2007 to June 30, 2016 – close to the market peak through to this year. It is worth noting that nothing particularly dramatic has happened in the months since July that would substantially change this – leaving us right now about six months away from a 10-year period of poor returns, well beyond the ‘five to seven' year period often cited as a holding period for growth assets.
Chart 1: Total returns (income and growth) from asset classes – July 1, 2007 to June 30, 2016

Source: Vanguard
Looking at this data, it is clear that the key Australian asset classes of listed property and Australian shares have provided an extended period of below average returns. In this case they trail the returns from cash. It is worth noting that the returns from these investments include both the price movement and dividends paid – in the case of Australian shares, the price movement has been negative over this period but a stream of income has been paid, leading to the overall positive return.
The bottom of the market then happened in early 2009 – in the case of Australian shares they fell in value by around 50 per cent (bottoming in the low 3000s). This is a tremendous loss of value but consistent with market falls in 1987, the early 1970s and the Great Depression in Australia.
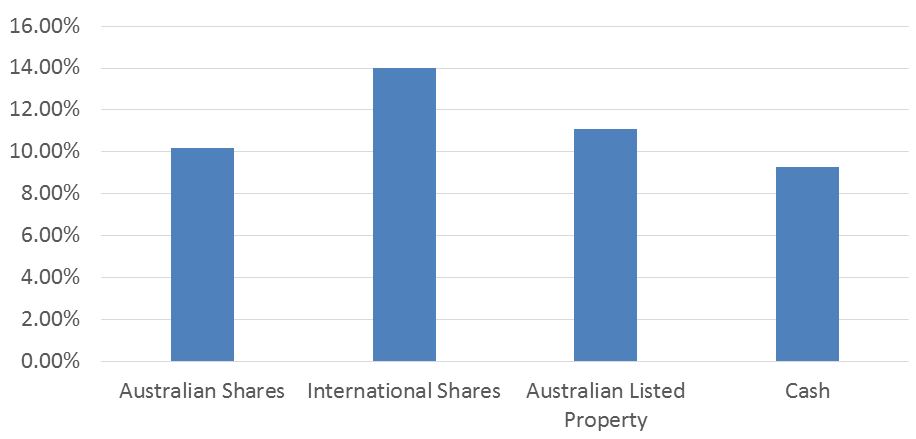
So, what has happened since then? The following data shows the period from July 1, 2009 (just after the market bottomed) to June 30, 2016. It shows that investors who used 2009 as a buying opportunity have been rewarded. Interestingly, the worse performing asset class from 2007 to 2016 (Australian listed property) has had the strongest return since 2009.
Chart 2: Market 'rebound' total returns – July 1, 2009 to June 30, 2016
Previous 10-year returns from ‘tough market periods'
The 1987 crash is the most recent of the big falls in Australian markets, happening towards the end of 1987. To look at the 10-year recovery from this, we can look at returns from July 1, 1988 to June 30, 1998. Interestingly, as the following graph shows, the returns following this downturn don't look all that different to what we are looking at in this current post Global Financial Crisis period – reasonable returns without anything particularly spectacular.
Chart 3: Post '1987 crash' returns – July 1, 1988 to June 30, 1998
The period in the early 1970s was also a poor period of returns from Australian shares. For the period June 1970 to June 1975 a $10,000 investment in the average share market portfolio fell from $10,000 to $6900 when you include the value of dividends received. This might not seem like a historically large fall, but when you consider that inflation was above 10 per cent for an extended period of time, it was a significant destruction of purchasing power for investors who owned shares.
Chart 4: Share market recovery – July 1, 1975 to June 30, 1985
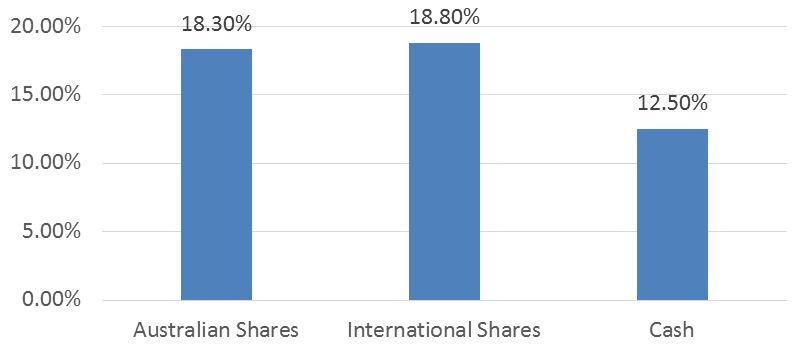
This recovery seems spectacular enough with 18-plus per cent returns for a period of 10 years. I am sure we would all sign up to that today if we could. However, with inflation relatively high over that period, and cash returns of 12.5 per cent, the returns from shares were only 5.8 per cent higher than that – a reasonable return for the risk of investing in shares.
It is, of course, a little harder to find market data around the time of the Great Depression. A book of Australian Historical Statistics was produced for the Australian Bicentennial and contains some share market data back to the late 1800s. It shows that at June 30, 1929 the All Ordinaries index was at 52.5 points, and over the next two years fell to 30.2 points. This is consistent with a fall of around 50 per cent, as the highest and lowest points will have been more extreme than these end of financial year values.
The market then recovered over the 10 years from June 30, 1931 to almost exactly double to a value of 60.3 by June 30, 1941. Over this period the market yield was always above 4.5 per cent, with a peak of 8 per cent – adding to the returns from the price-index doubling.
Final word
Clearly the ‘five-to-seven-year' rule for expecting a positive experience for investing in shares is challenged by this current period, where we are on the cusp of a 10-year period with negative price returns.
It is interesting to look back to previous market downturns; investors who were disciplined, and held Australian shares after a downturn, were rewarded over the next decade.
That said, I don't think it can be argued that subsequent returns will necessarily be positive or exceptional, rather that shares have provided returns in excess of cash over these periods.
Early evidence is that this is certainly the case for investors who bought shares around the bottom of the market in 2009.


Frequently Asked Questions about this Article…
The 'five-to-seven-year' rule is being challenged because recent data shows that Australian shares have underperformed over a nearly 10-year period, with cash outperforming domestic equities since mid-2007. This suggests that the traditional timeframe may not always guarantee positive returns.
Since the Global Financial Crisis, Australian shares have experienced a significant downturn, with a 50% drop in value by early 2009. However, investors who bought shares around the market bottom in 2009 have seen positive returns, as the market rebounded in the following years.
In recent years, cash has outperformed Australian shares, as well as listed property. This is evident from the data showing that cash returns have been higher than those from Australian shares over a nearly 10-year period.
Investors can learn that holding onto shares during market downturns can lead to rewards over the long term. Historical data shows that disciplined investors who held shares after downturns, such as the 1987 crash, were rewarded with reasonable returns over the next decade.
After the 1987 crash, the Australian share market experienced a recovery over the next decade, with reasonable returns. Although not spectacular, these returns were consistent with the market's historical performance following downturns.
In the 1970s, high inflation significantly impacted share market returns. Although the market recovered with 18-plus percent returns over a decade, the high inflation rate meant that the real returns were only moderately higher than cash returns.
During the Great Depression, the Australian share market experienced a dramatic fall of around 50%. However, over the following decade, the market recovered, nearly doubling in value by 1941, with consistent market yields contributing to overall returns.
Despite recent challenges, investing in shares can still be a good option for long-term investors. Historical evidence suggests that shares have provided returns in excess of cash over extended periods, especially for those who invest during market lows and hold their positions.


